Explore all globe scenarios.
Industry-specific interactive globe demos. Filter by category or search by tag.
Showing 30 use cases
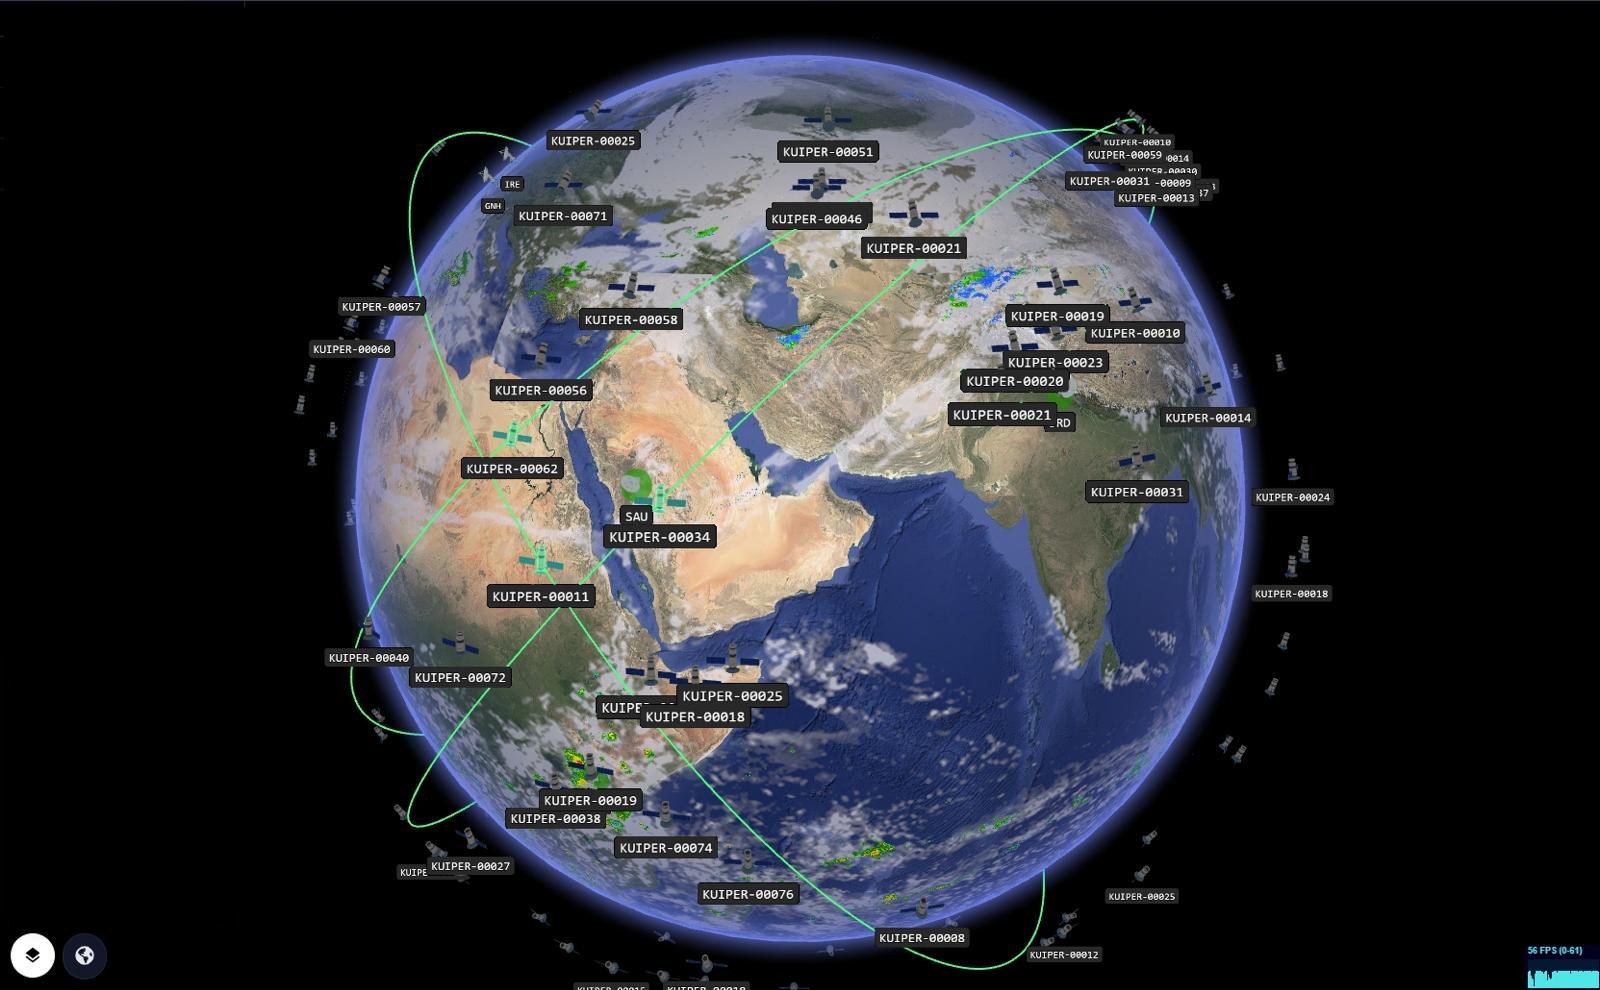
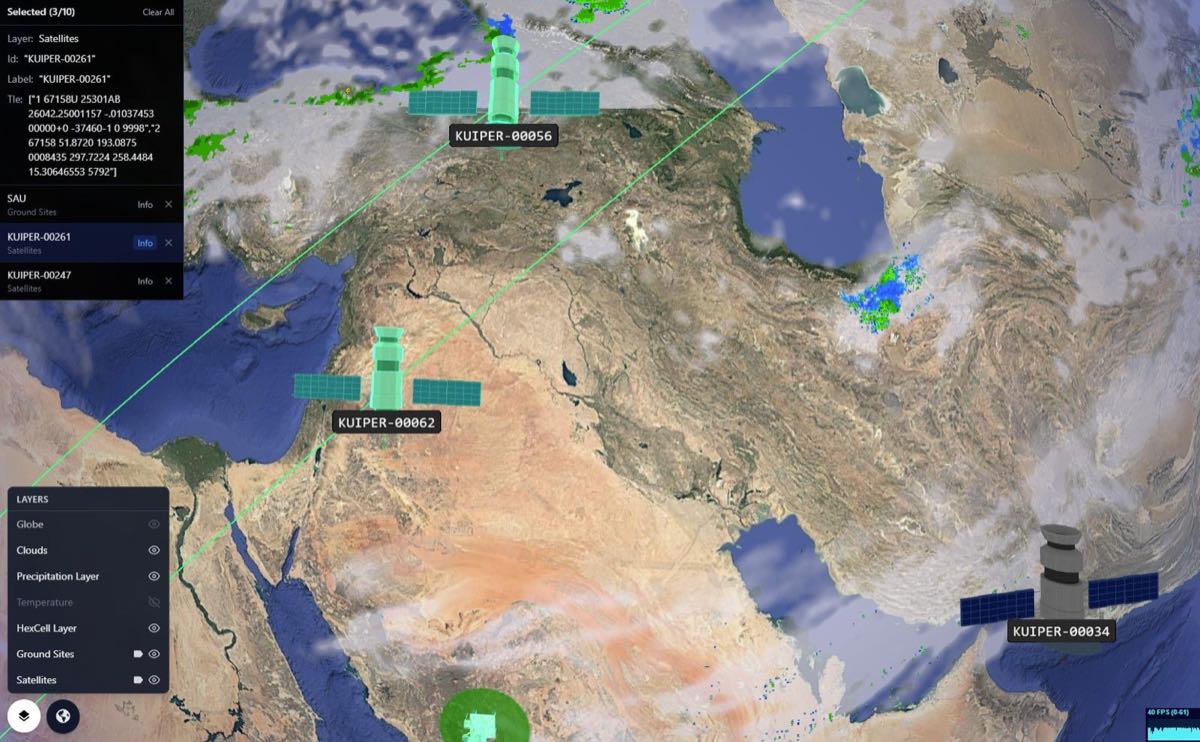
Satellite NTN + Ground Stations
Beams, coverage, gateways, and signal health — for telecom operations.
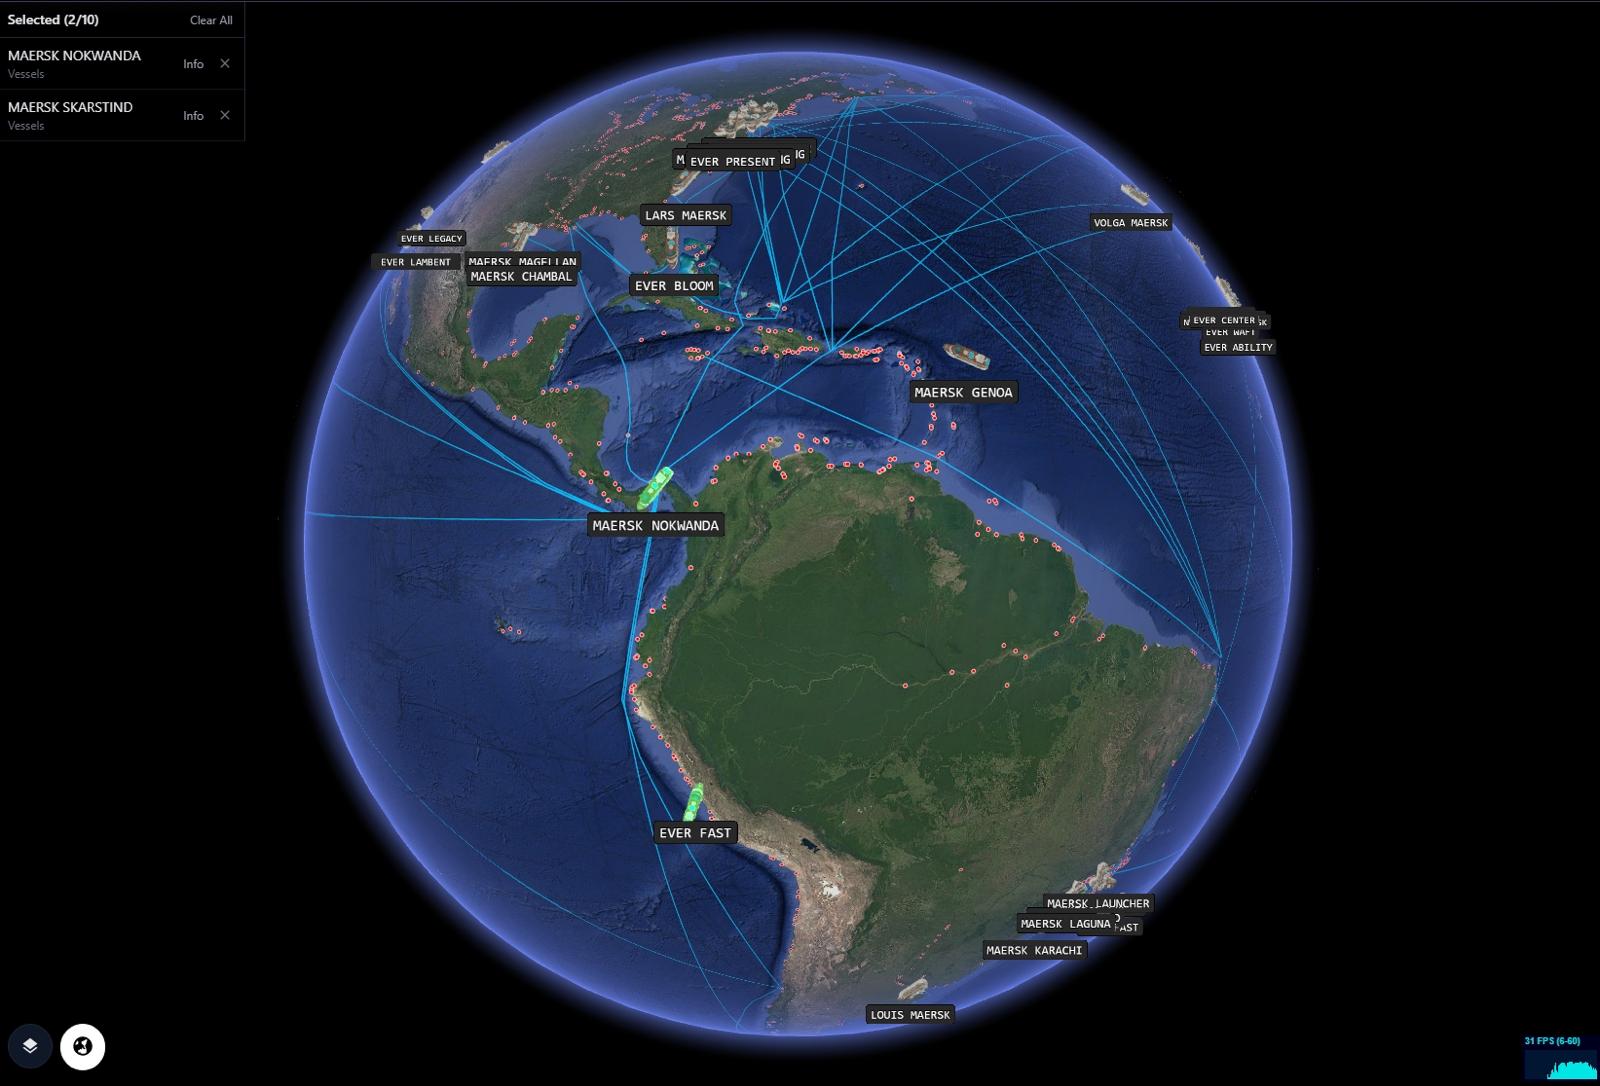
Ships & Fleets on Water
Routes, ports, ETAs, congestion, and risk zones on a live globe.
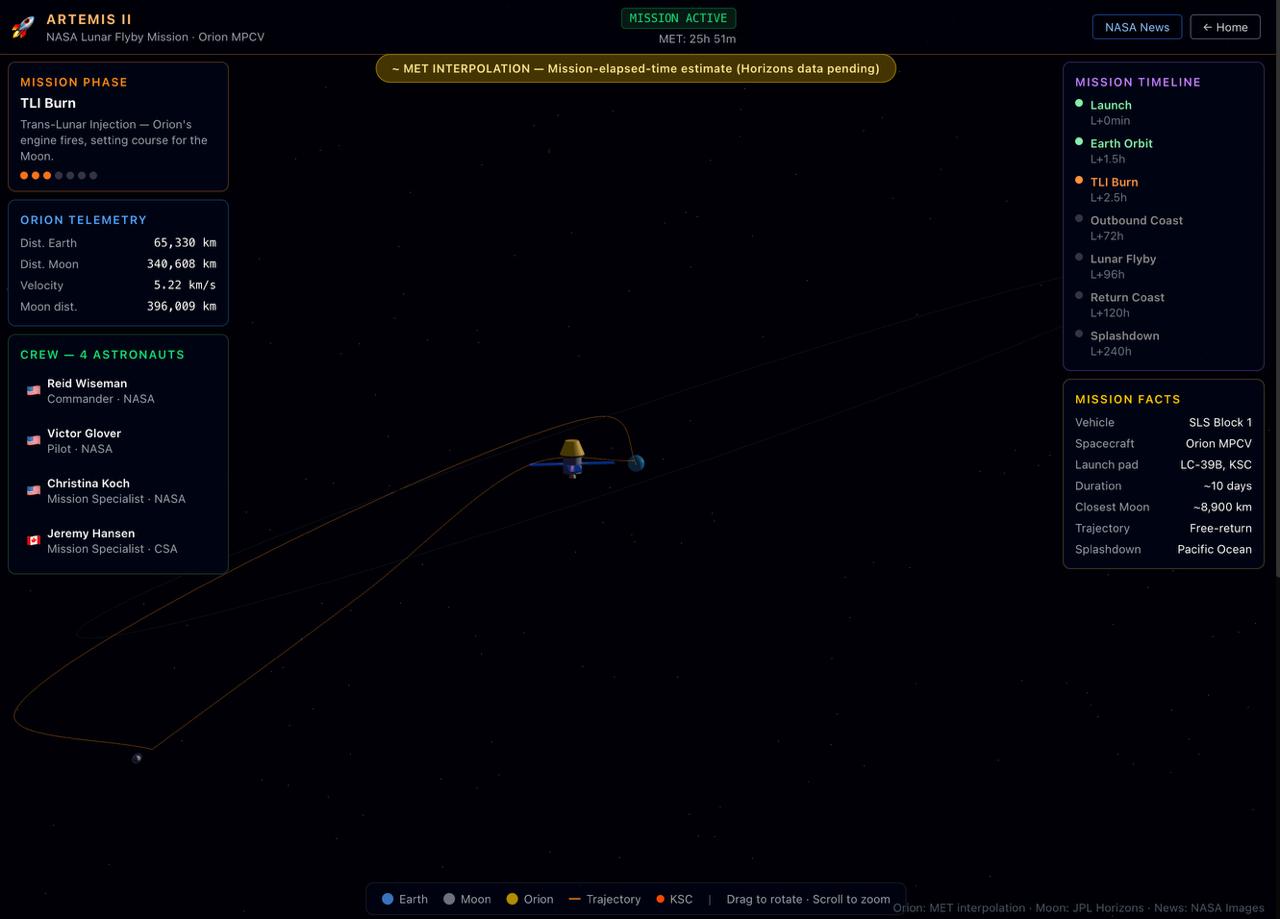
Artemis II — Moon Mission Tracker
Real-time 3D tracker for NASA's Artemis II crewed lunar mission — Orion trajectory, live Earth-Moon geometry, crew profiles, and mission timeline.
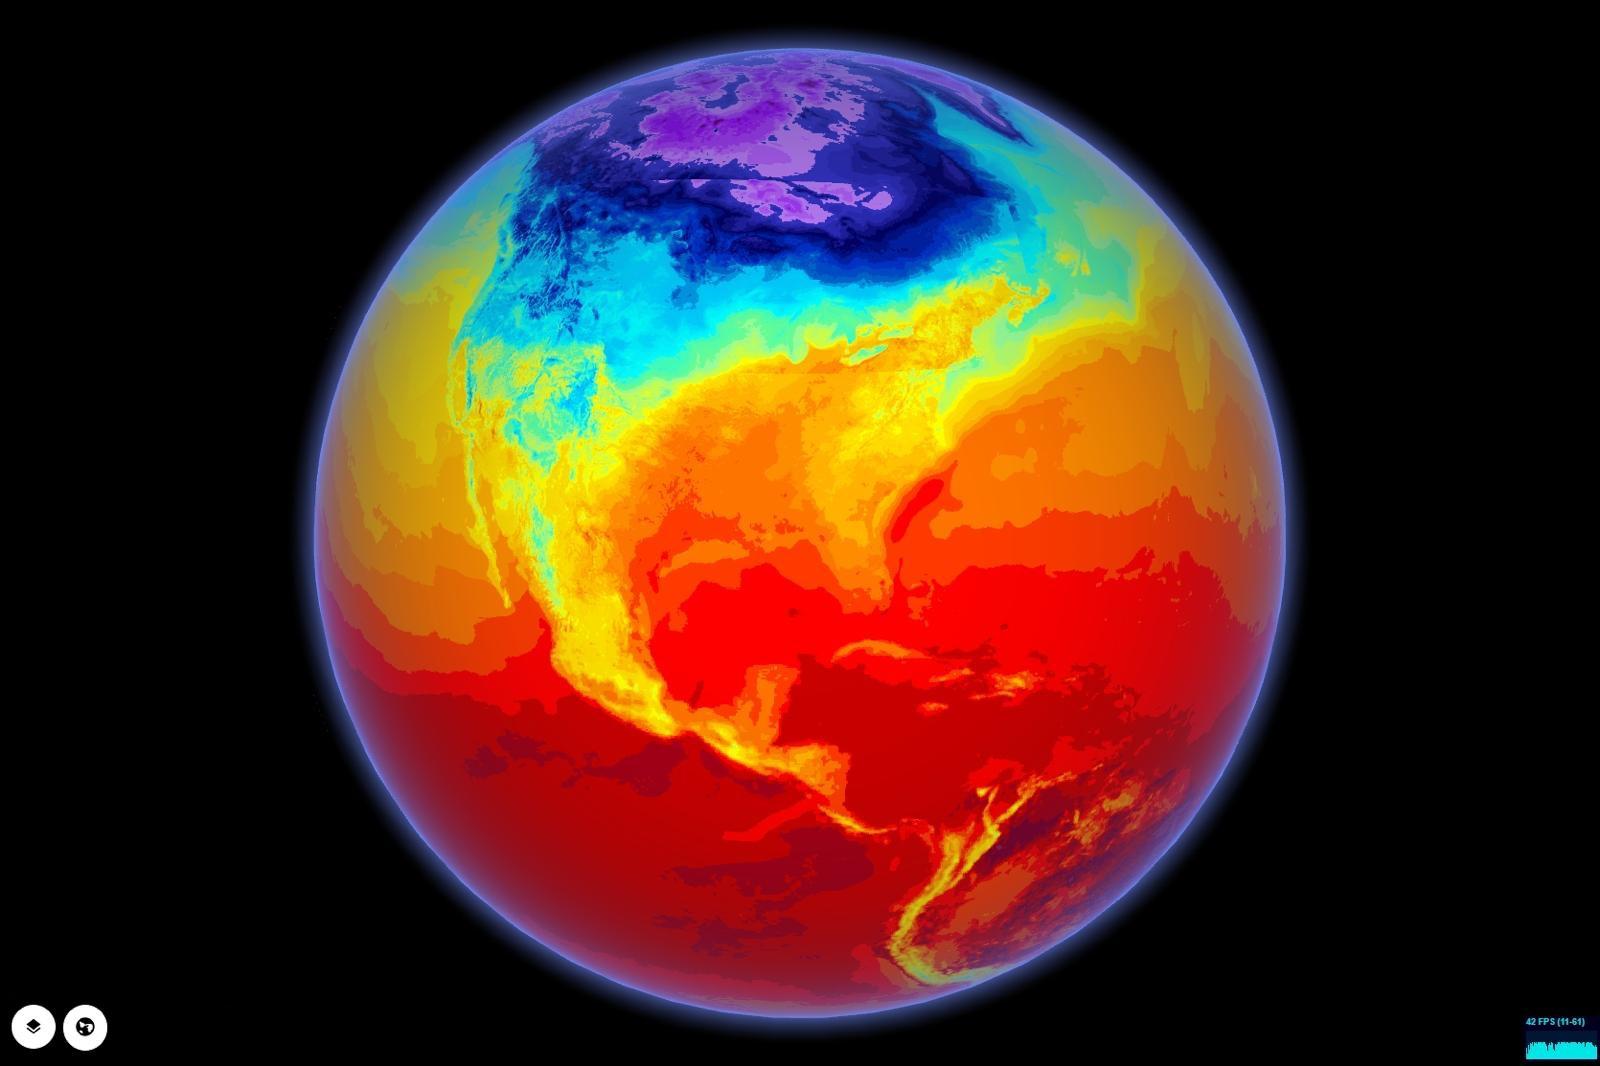
Weather & Meteorological Layers
Live weather overlays for planning, safety, and disruption prediction.
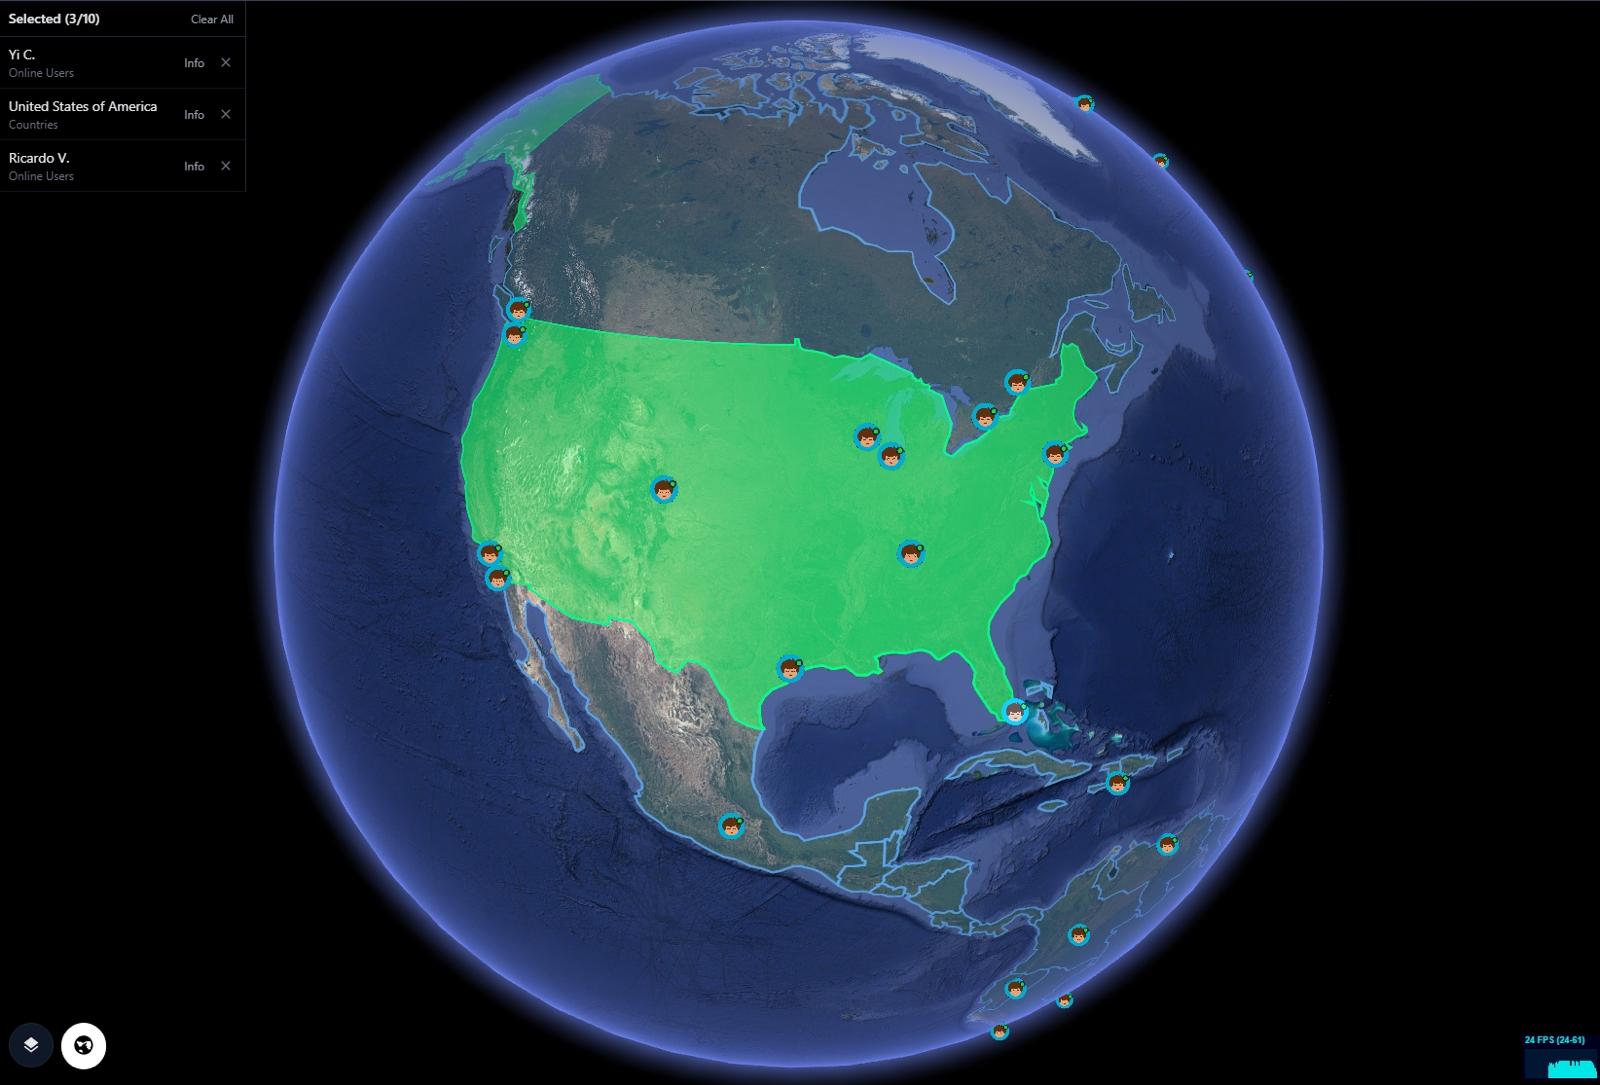
SaaS Startup Metrics on the Globe
Performance, churn detection, SEO and targeted ads on a live globe.
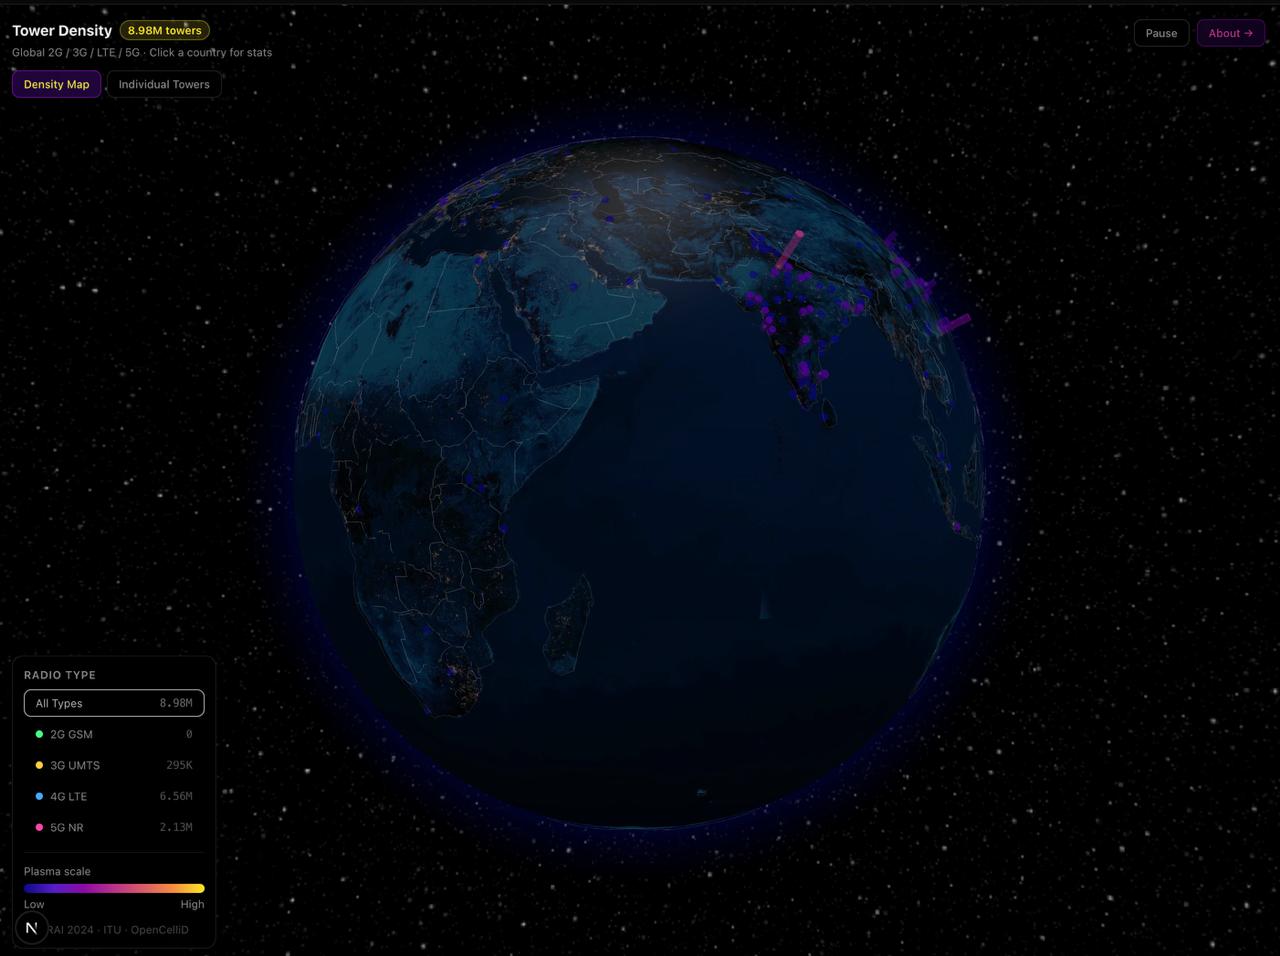
Cell Tower Density & Coverage
40M+ geolocated cell towers by generation — 2G GSM, 3G UMTS, 4G LTE, 5G NR — frequency bands, MCC/MNC operator codes, and signal reach on a live WebGL globe.
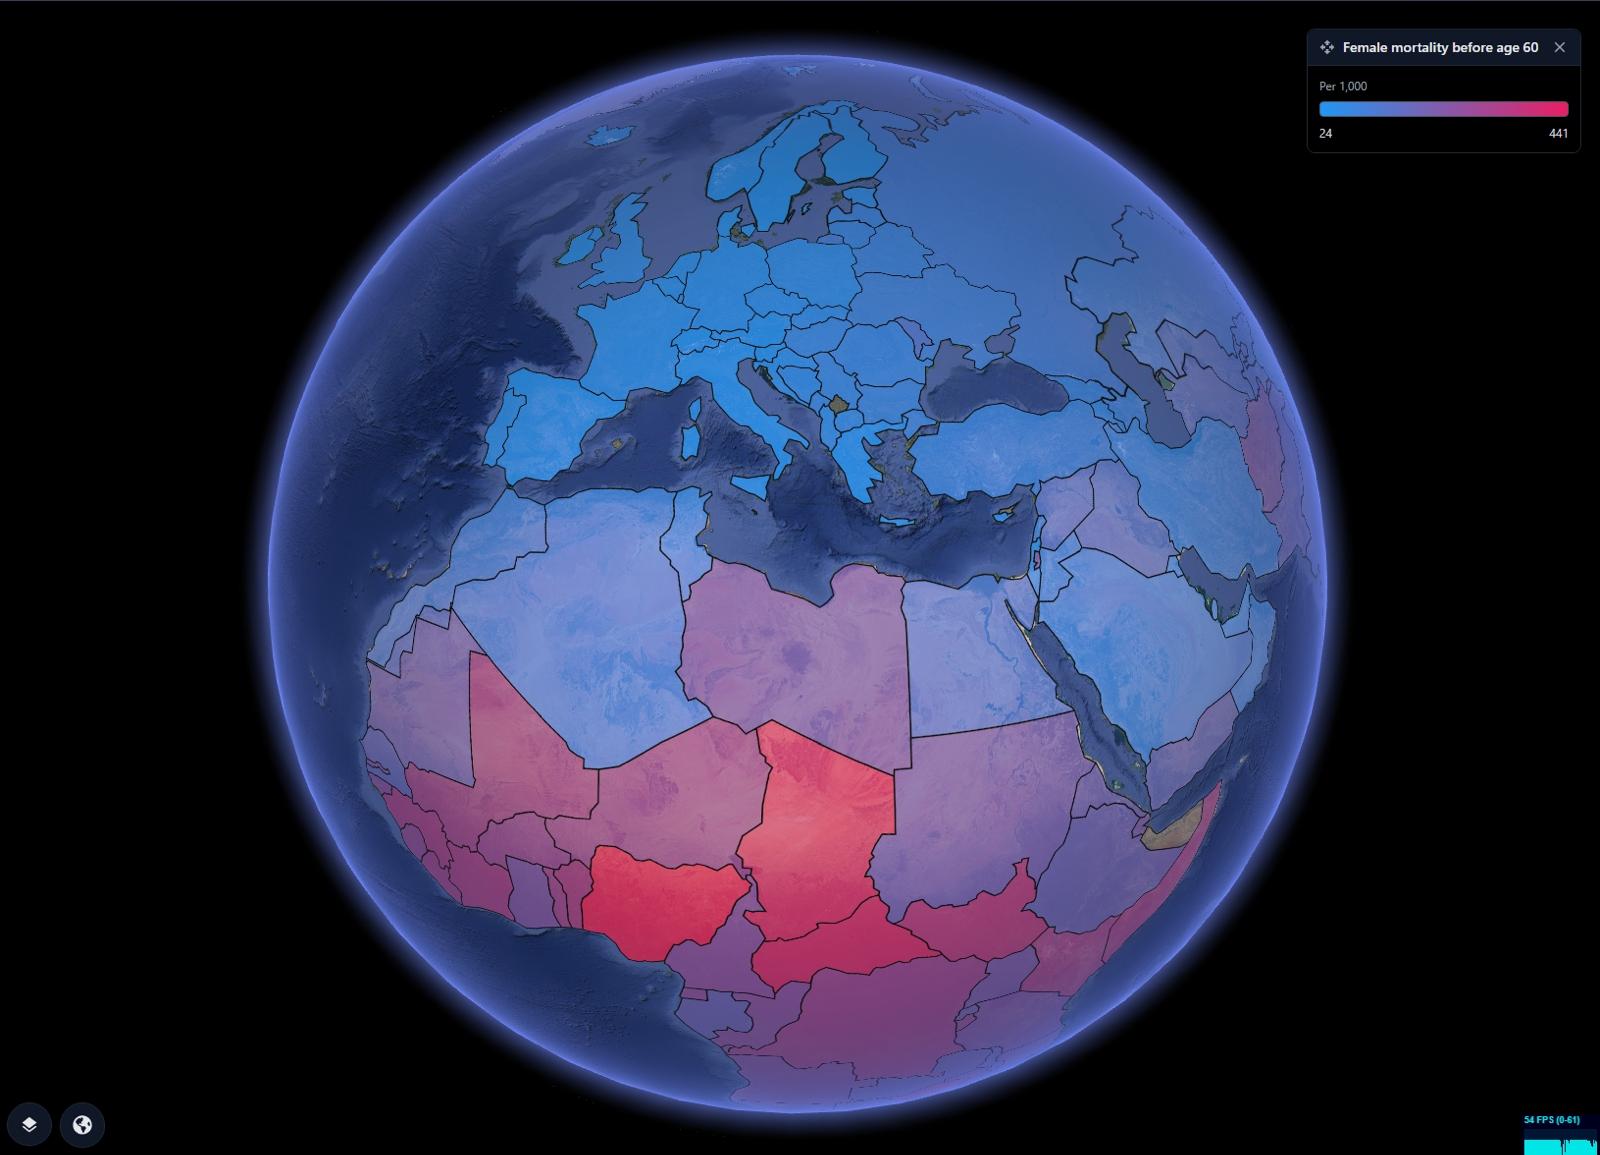
Demographics & Population
46 demographic layers, One LIVE globe.
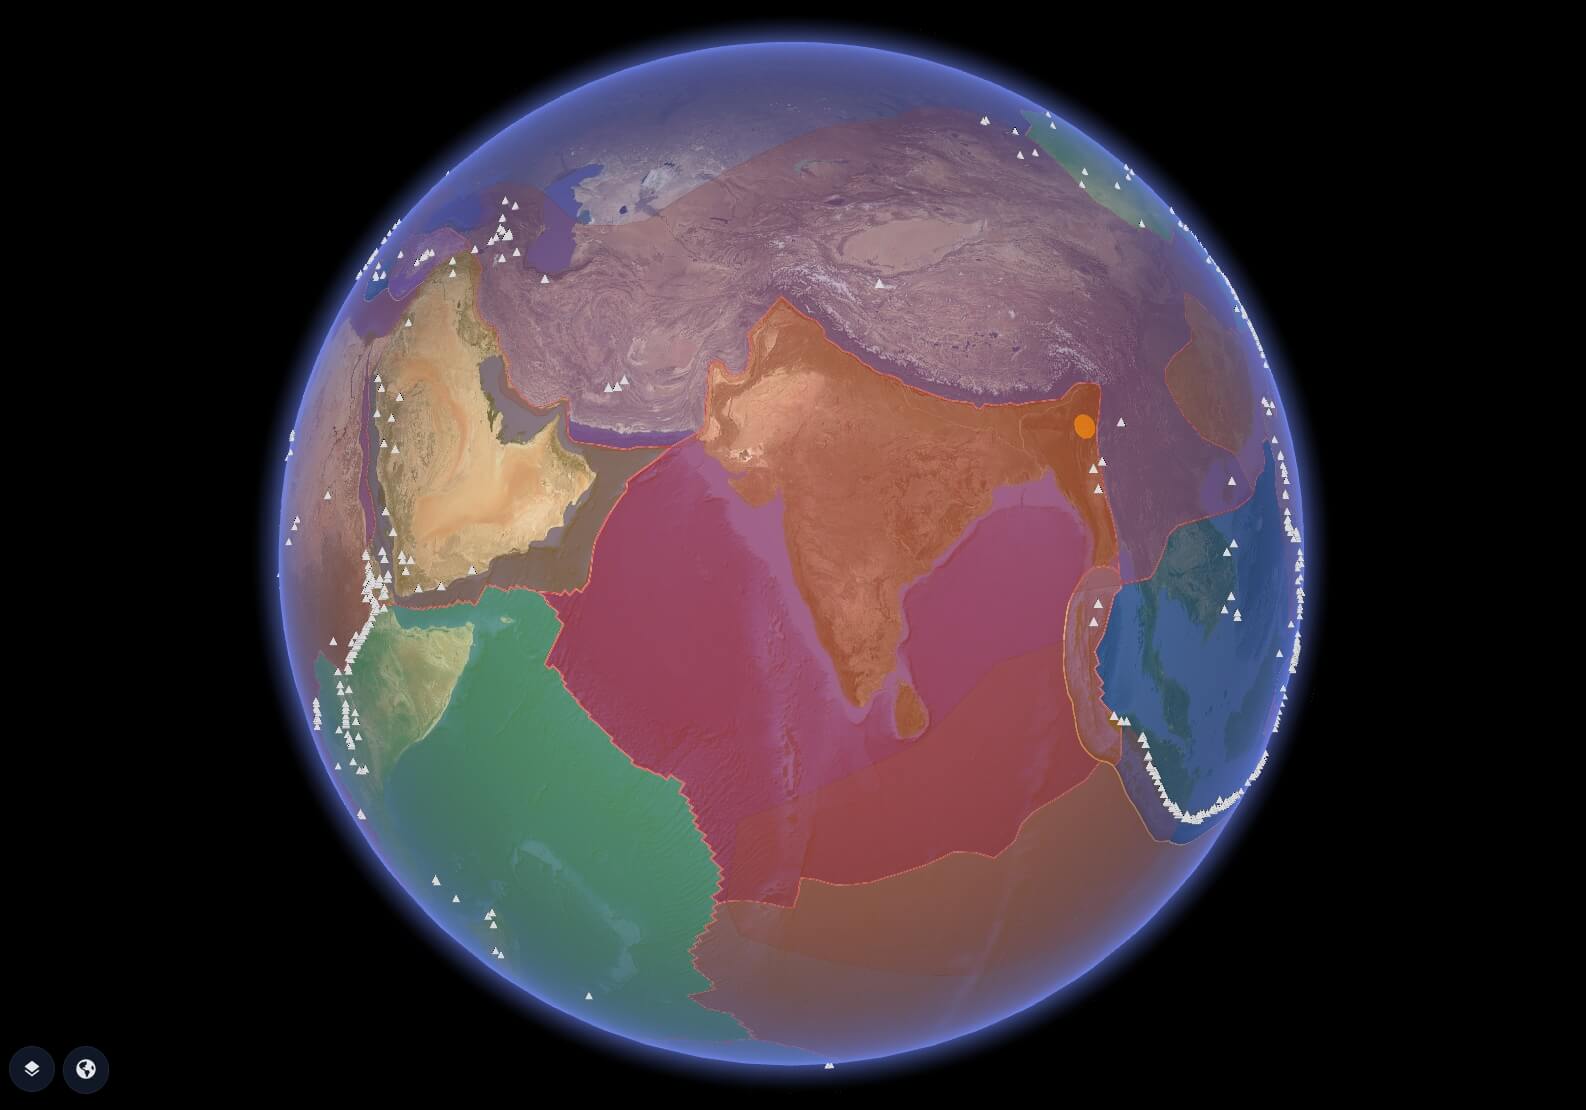
Plate Boundaries, Earthquakes & Volcanoes
Tectonic plates, live earthquake alerts, and volcano status on the globe.

World History & Civilization Atlas
2,500 years of human history on a 3D globe — empires, religions, migrations, and pivotal events from 500 BC to 2025. Interactive era timeline with animated layers.
NTN End-to-End Service Assurance
4-domain E2E service assurance: Satellite → Ground Station → RAN → Core, with real-time 1-min micro KPI monitoring.
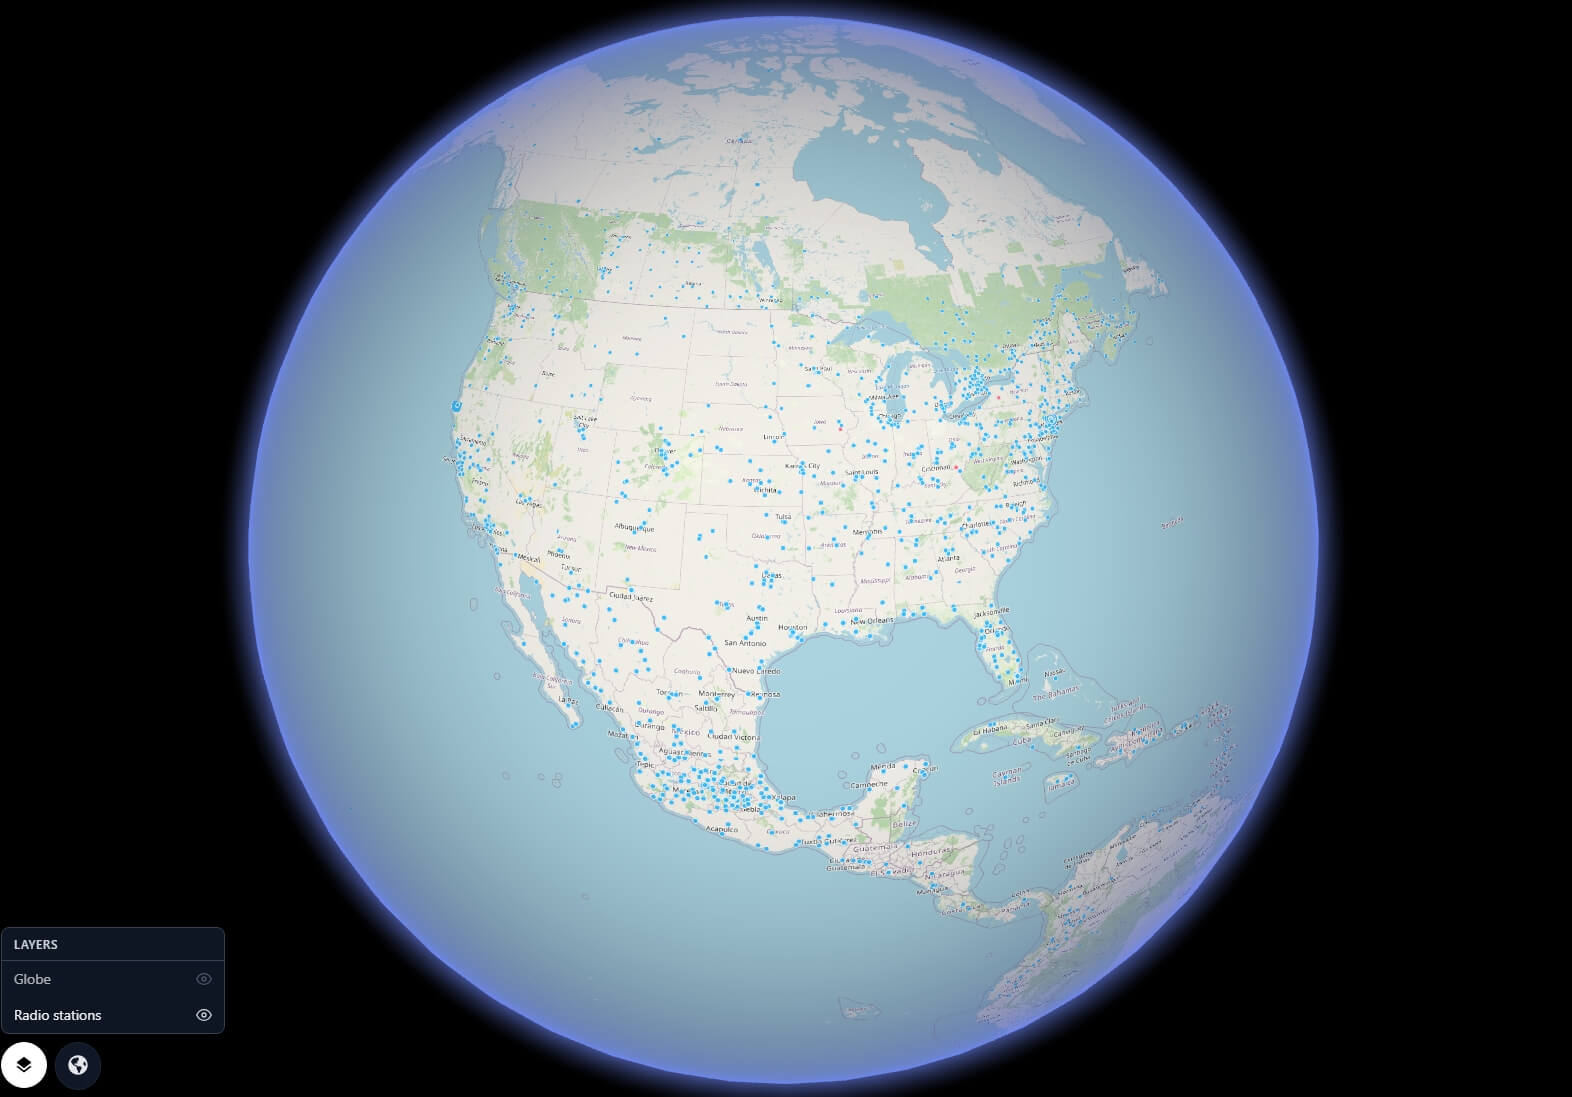
Live Radio Stations on the Globe
26,000+ internet radio stations from 246 countries — click to listen.
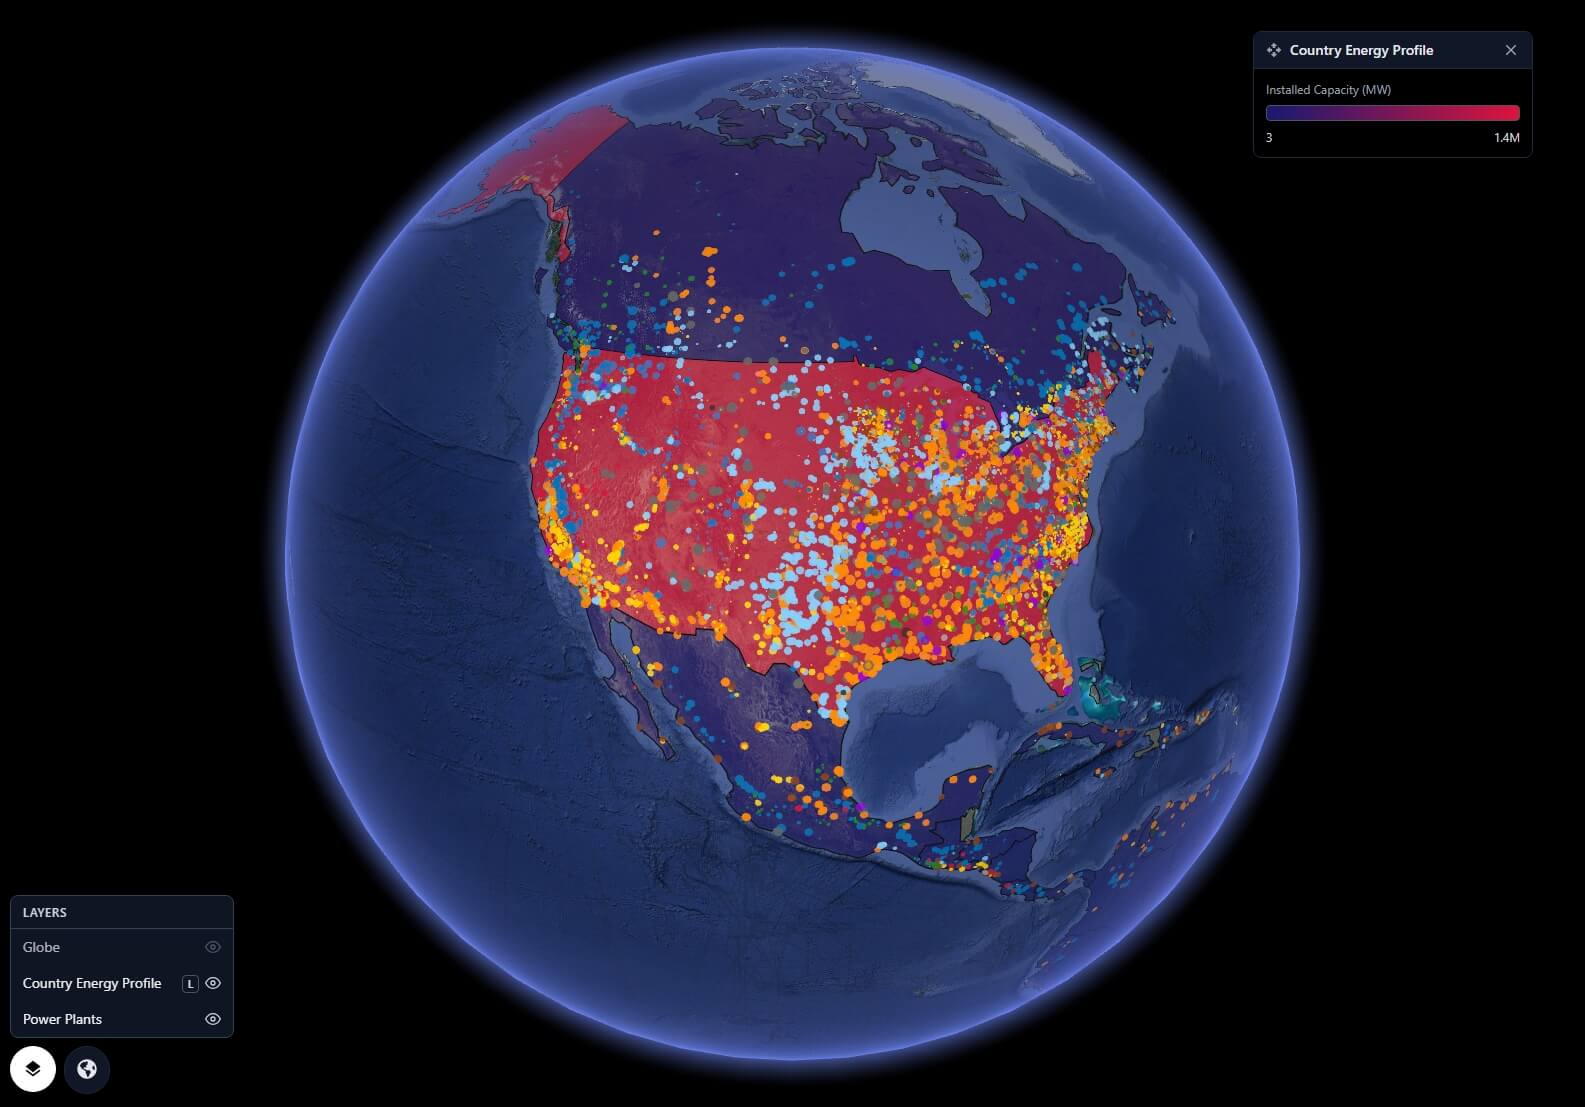
Country Energy Profile & Power Plants
Installed capacity by country and 35,000 geolocated power plants.
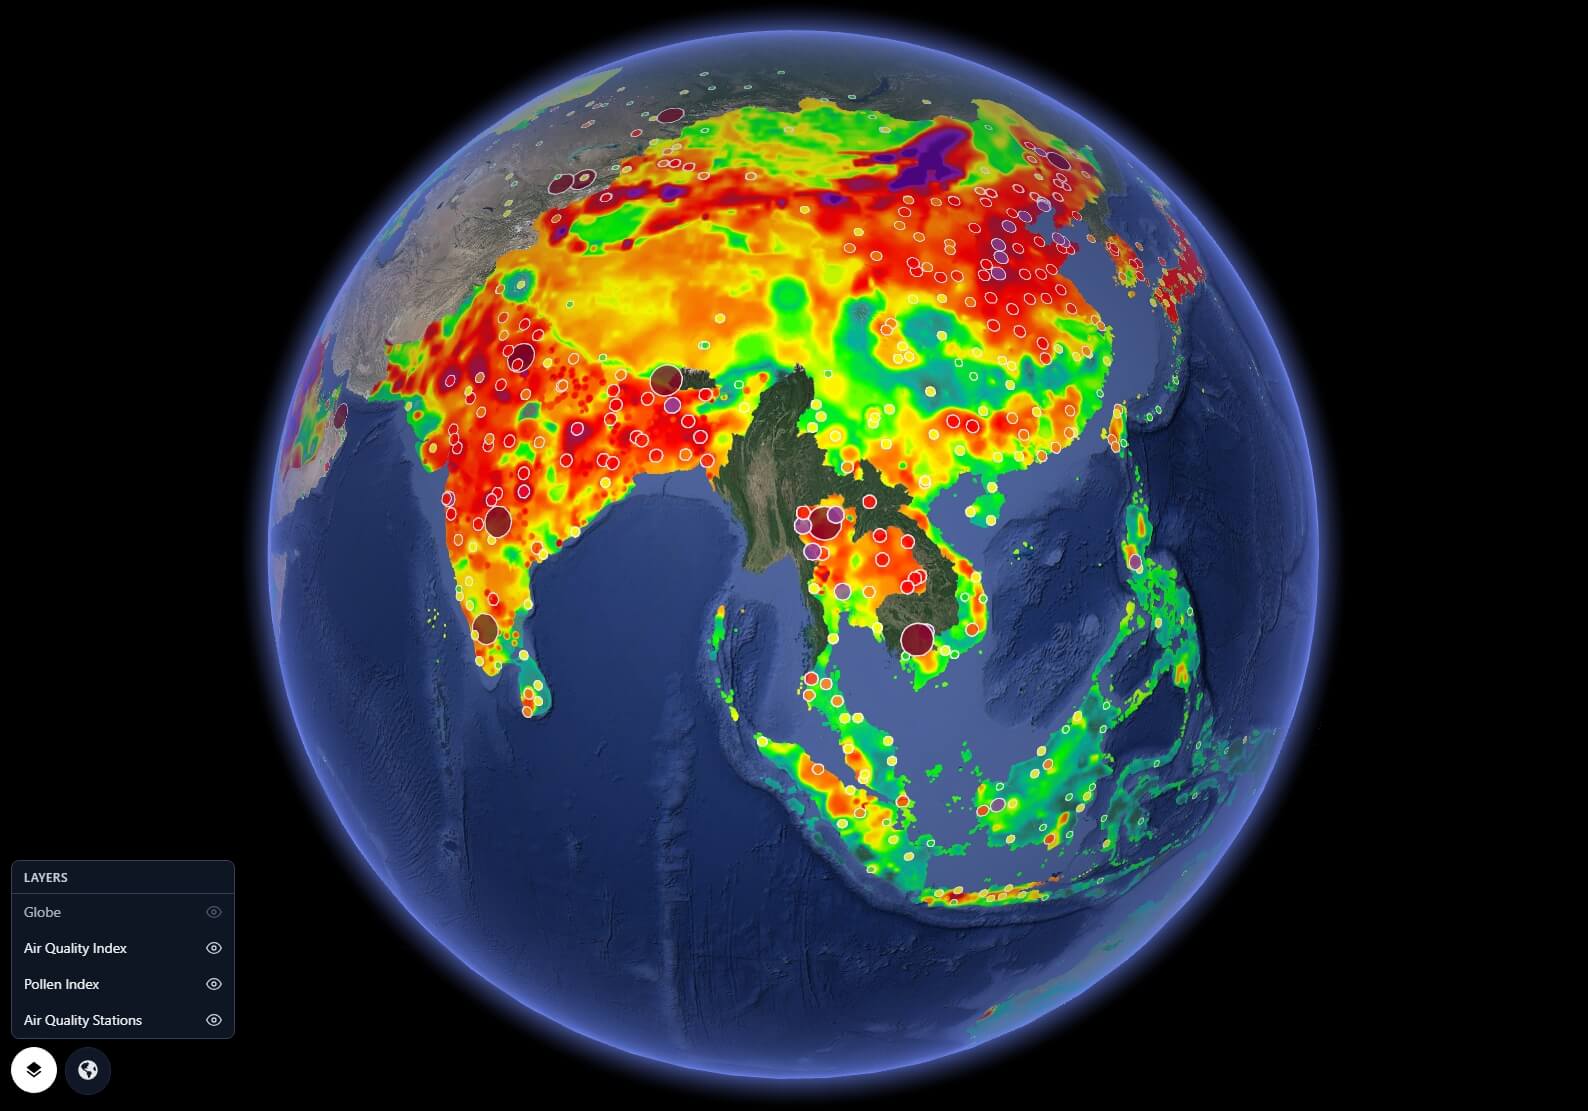
Air Quality Index, Pollen & Stations
Live AQI heatmap, Pollen Index, and 30,000+ monitoring stations.
World Job Market
50+ cities, 10 job sectors — filter by category, click any city, explore hiring trends and salaries on a live MapLibre map.
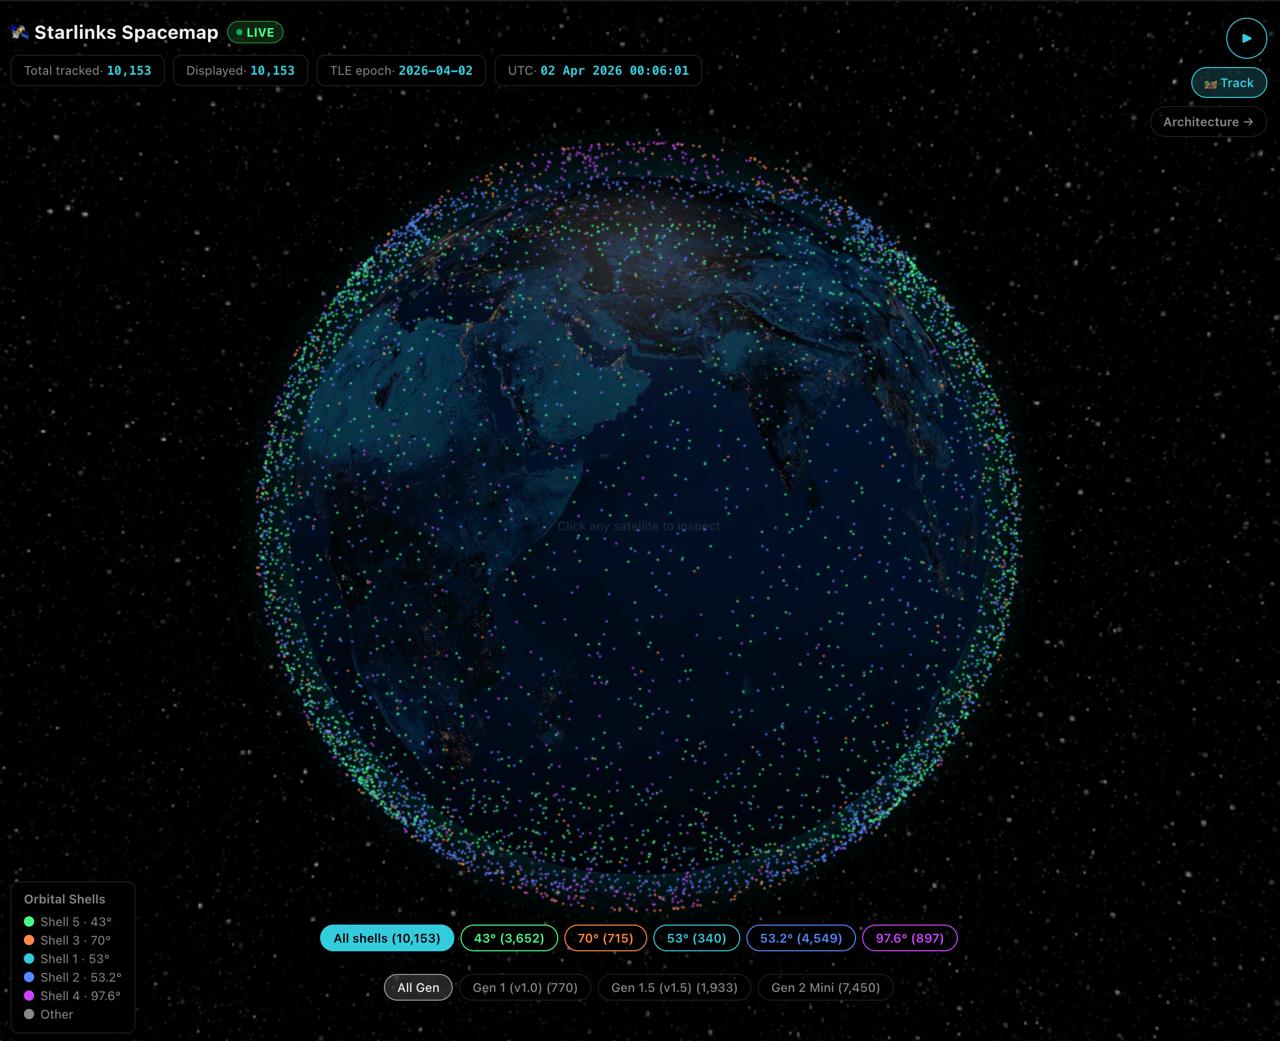
Starlinks Spacemap
Real-time tracking of 6,000+ Starlink satellites on a WebGL globe — live TLE orbital data, SGP4 propagation, orbital shell filters, and ground track visualization.
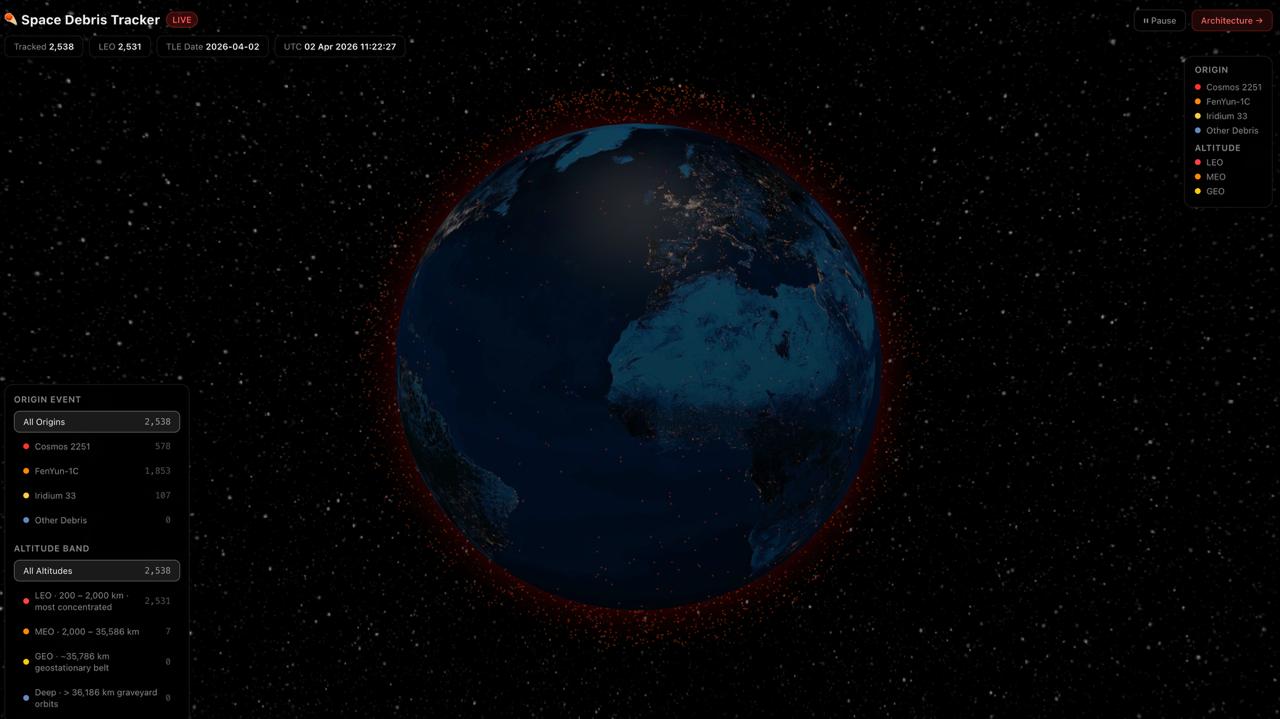
Space Debris Tracker
Real-time tracking of 5,000+ space debris objects on a WebGL globe — CelesTrak TLE data, SGP4 propagation, origin-event filters (Cosmos, FenYun, Iridium), and per-object orbital telemetry.
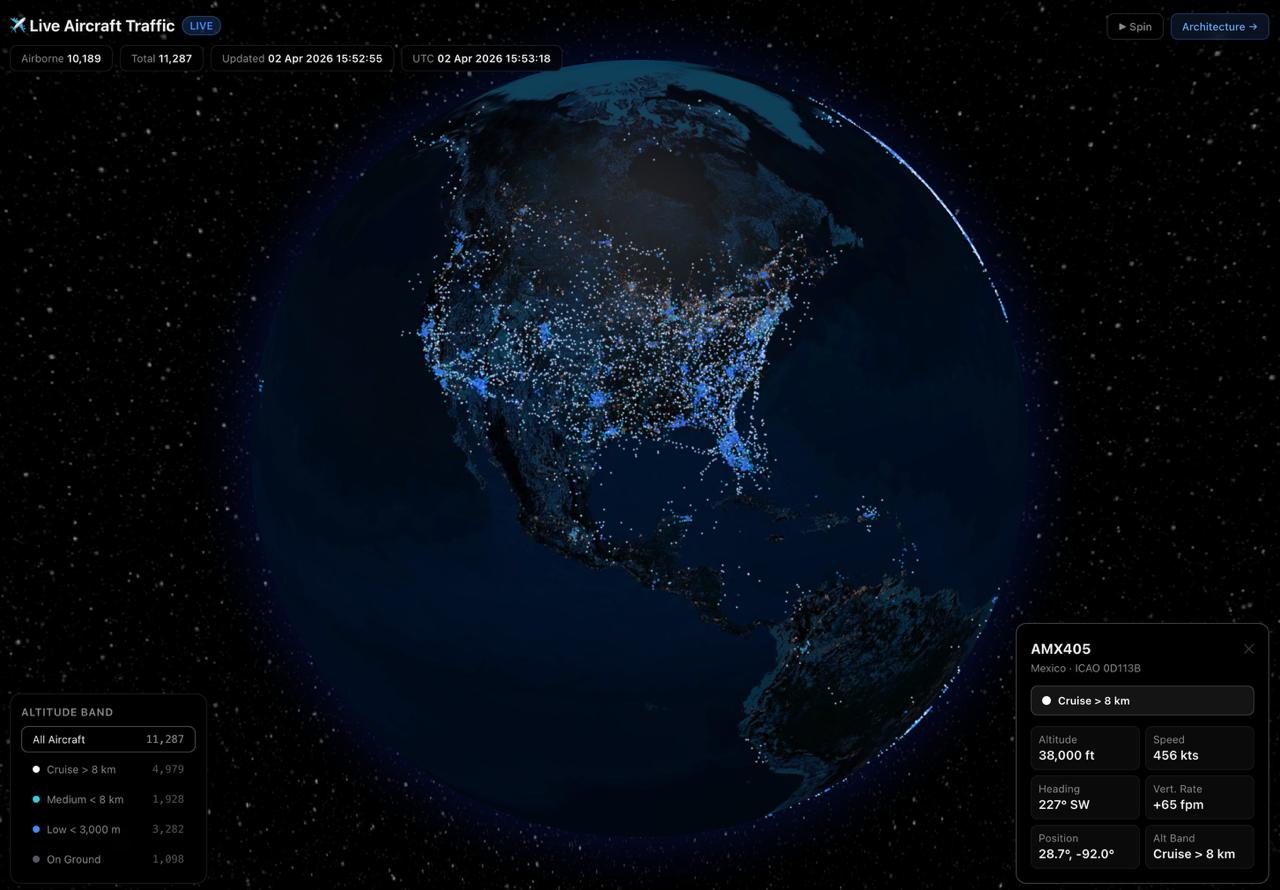
Live Aircraft Traffic
10,000+ airborne aircraft tracked in real time on a WebGL globe — OpenSky Network ADS-B data, altitude-band colour coding, and per-aircraft telemetry.
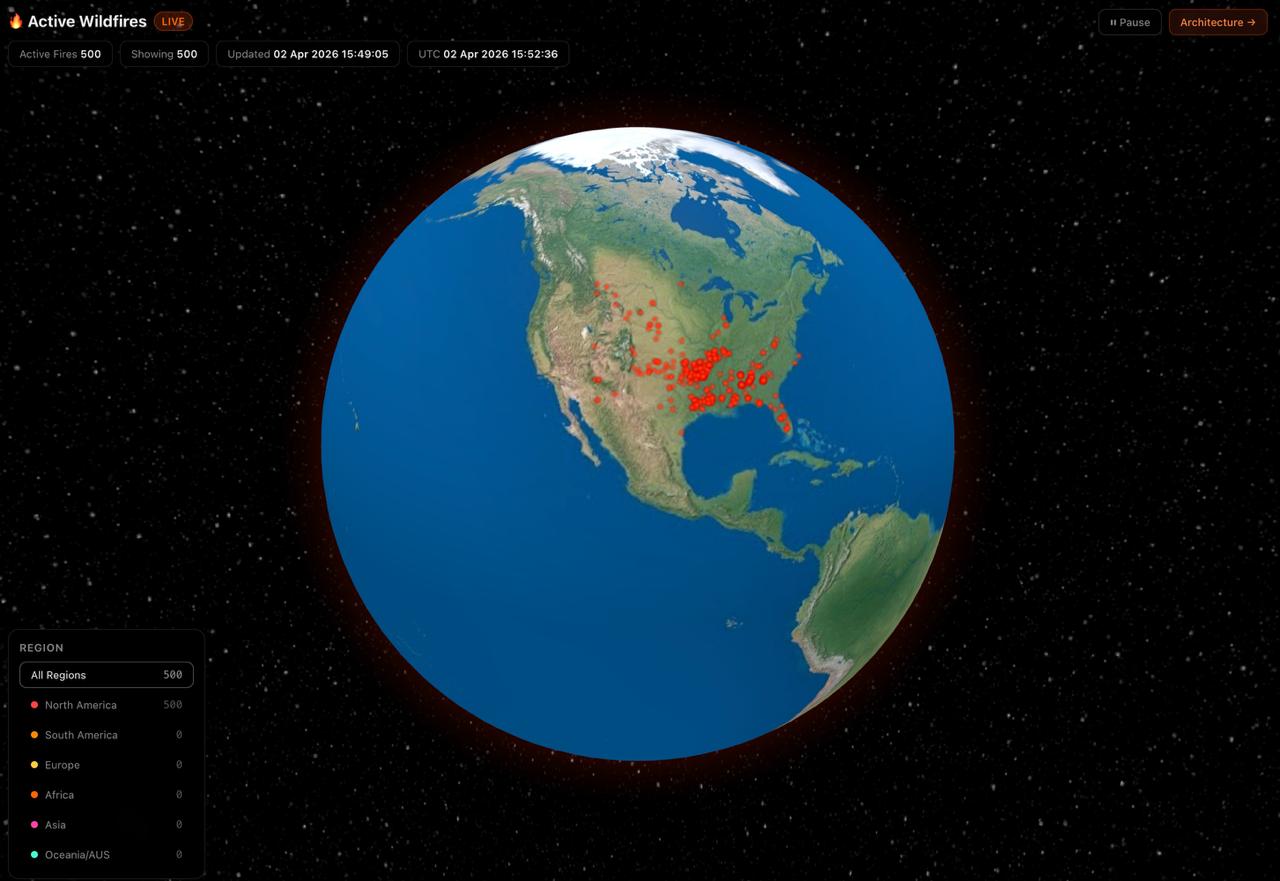
Global Natural Hazards Monitor
Real-time tracking of 500+ active natural hazards worldwide — wildfires, severe storms, earthquakes, volcanic activity, floods, and icebergs on a live 3D globe.
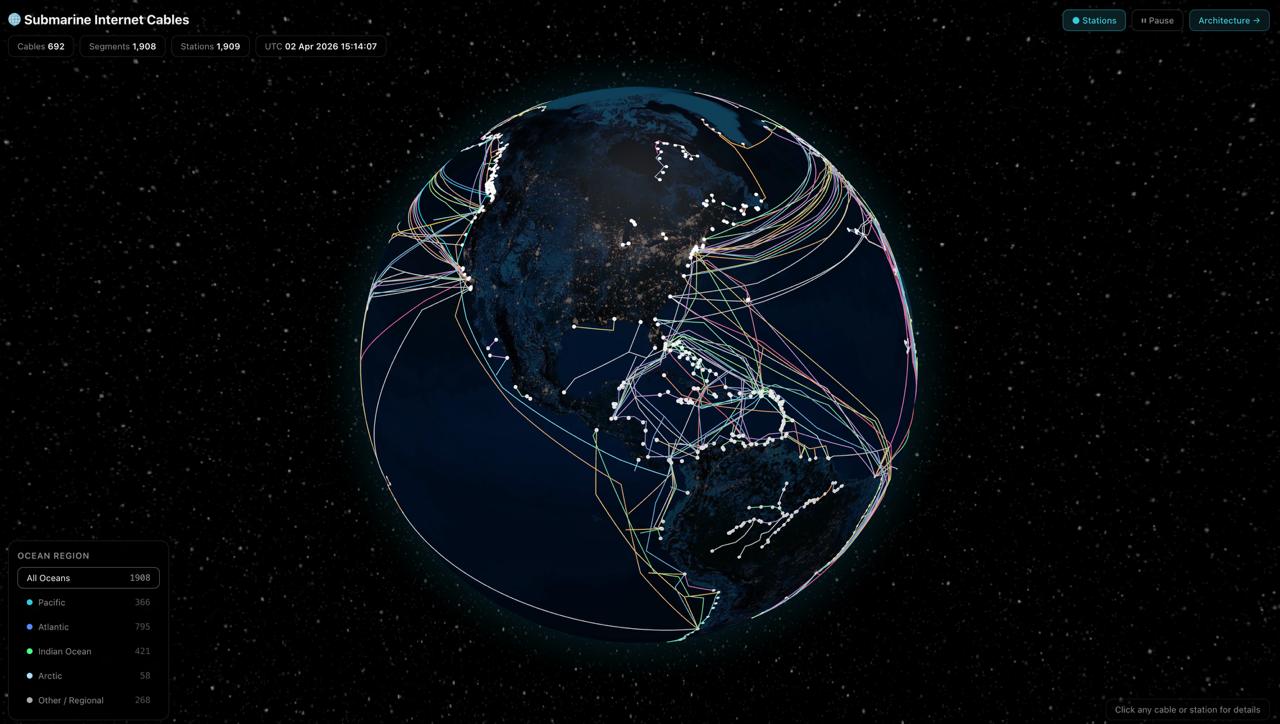
Submarine Internet Cables
500+ submarine internet cables carrying 95% of global data traffic, visualised as geodesic paths on a WebGL globe — TeleGeography public GeoJSON, ocean-region filters, landing stations.
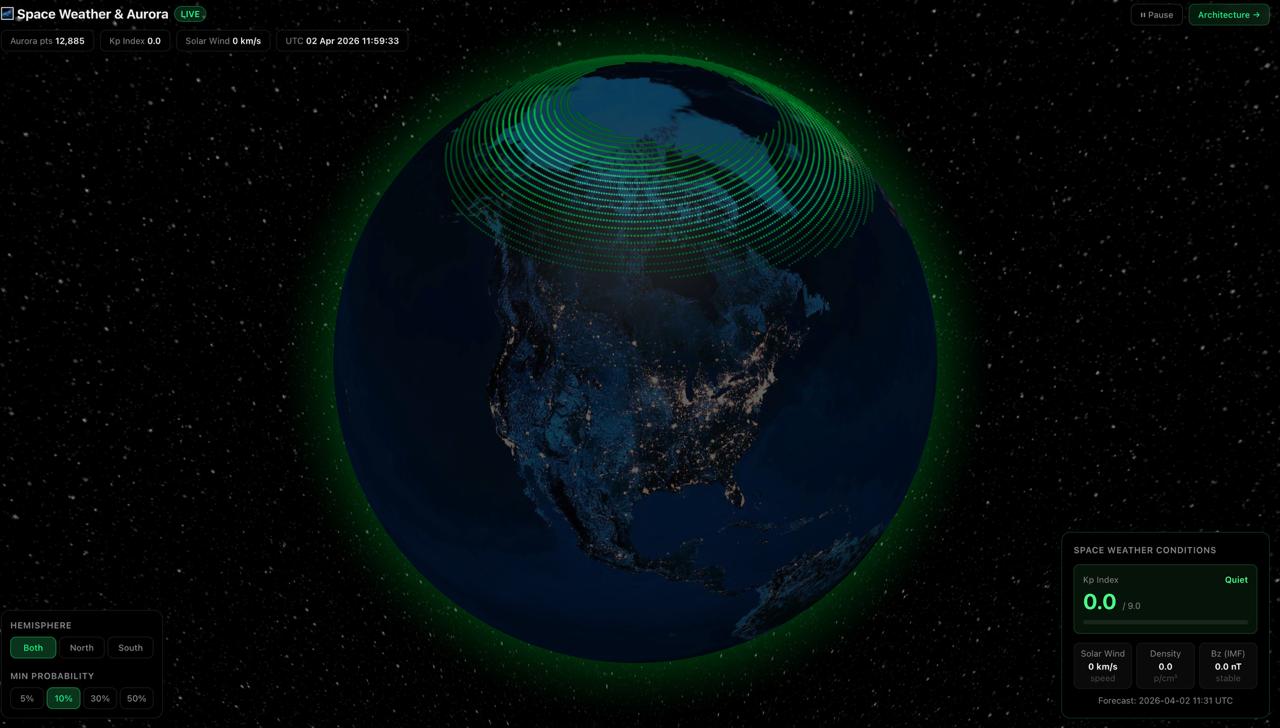
Space Weather & Aurora
Live aurora borealis and australis ovals at accurate 120 km altitude on a WebGL globe — NOAA SWPC Ovation Prime forecast, Kp index, solar wind, and IMF Bz component.

Stock Market & Financial Globe
Global GDP choropleth, stock exchange markers, live FX rates, and animated capital flow arcs — World Bank + Frankfurter data on a live WebGL globe.

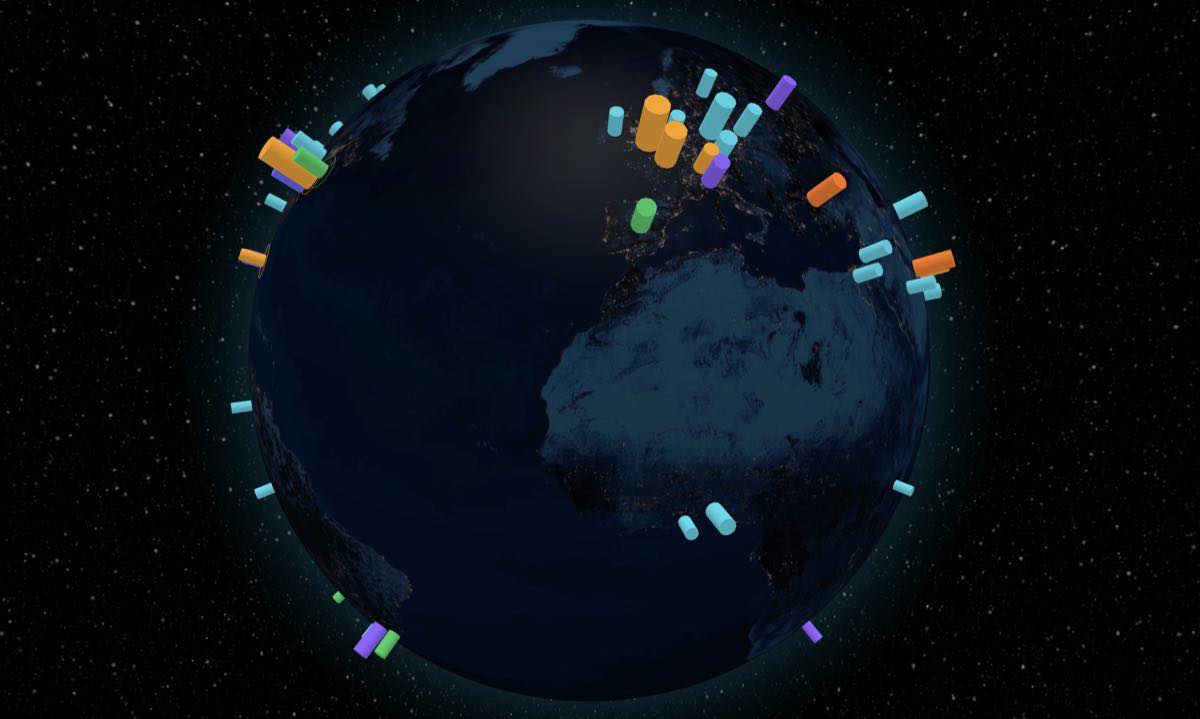
Global Crops & Agriculture
FAO crop production data for 8 crops across 80+ countries — wheat, rice, maize, soybeans, coffee, cocoa, sugarcane, cotton — rendered as 3D production bars on a WebGL globe.
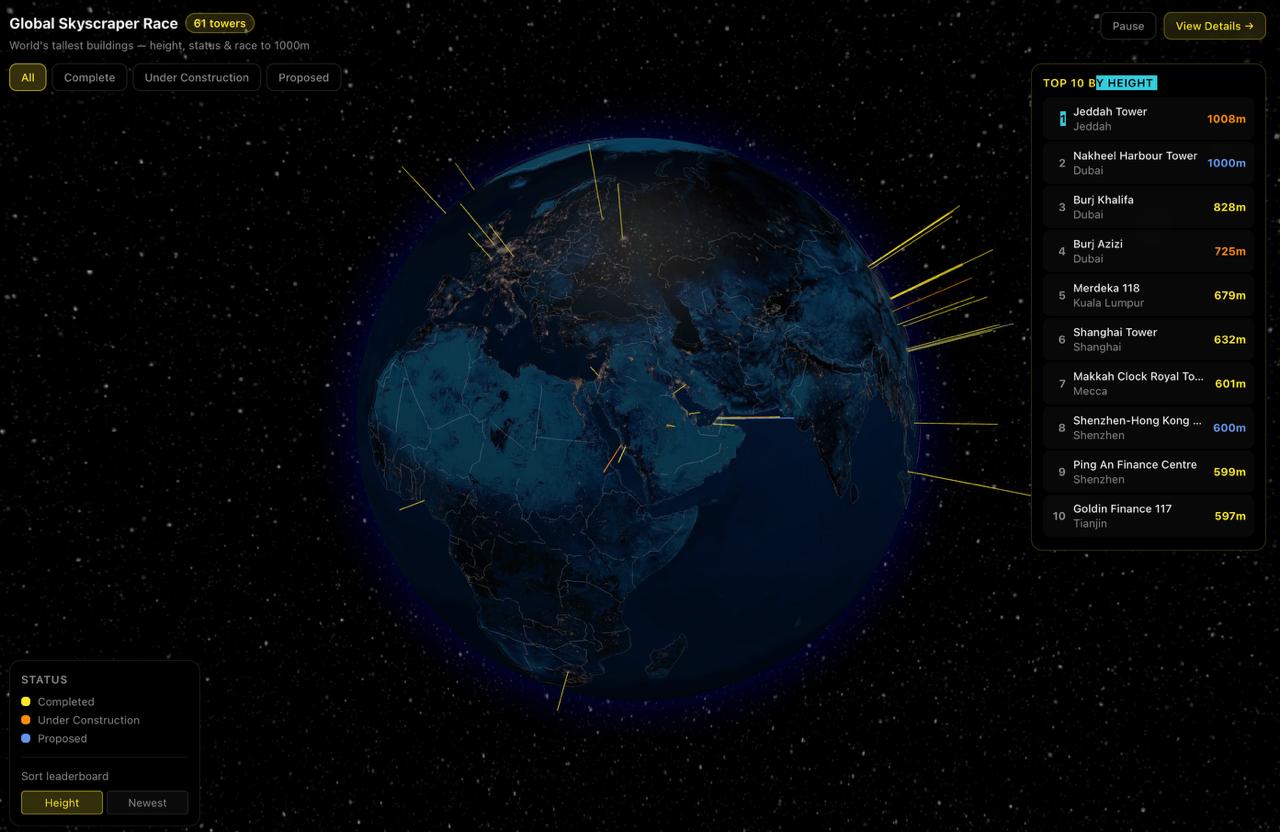
Global Skyscraper Race
The race to 1,000m — 60+ of the world's tallest buildings by height, status, and construction era on a 3D globe.
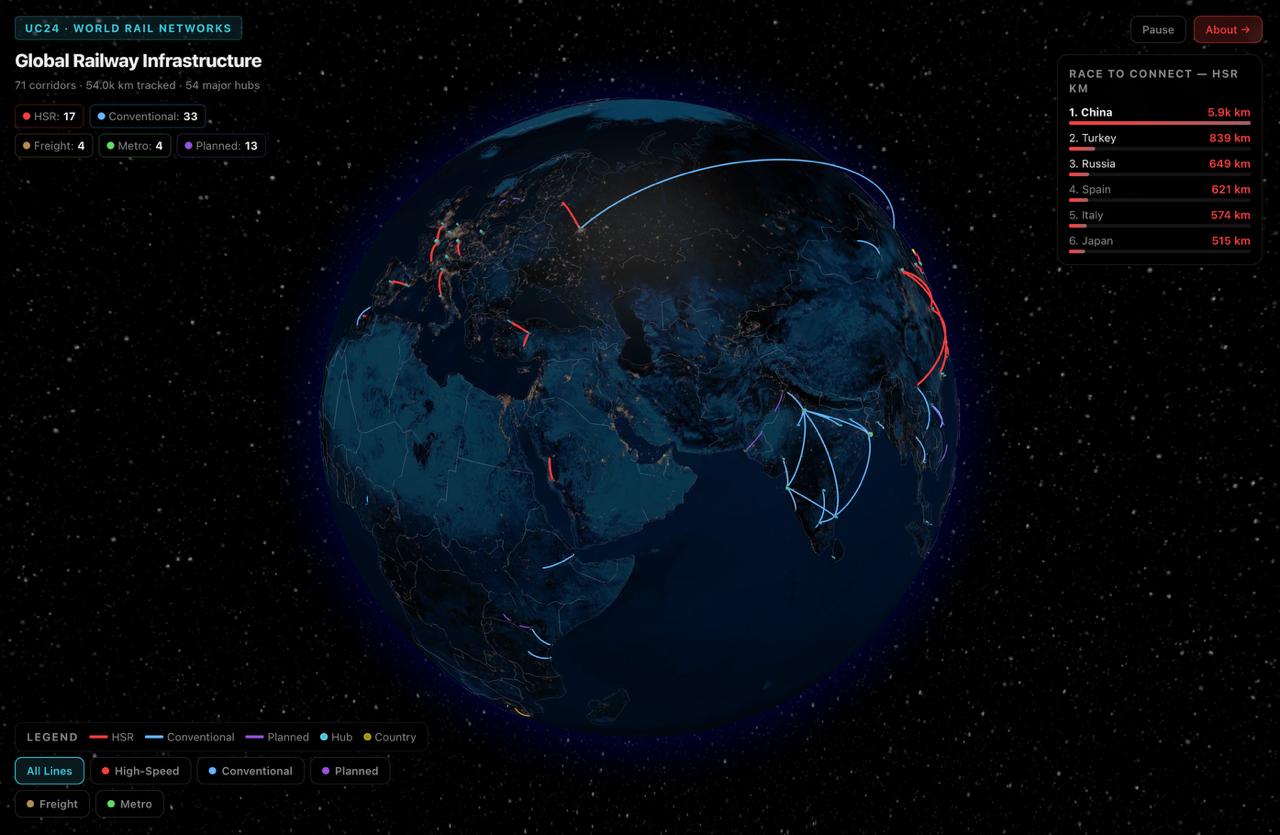
World Rail Networks
Global railway infrastructure on a 3D globe — HSR corridors, passenger flows, and planned mega-projects across 25+ countries.
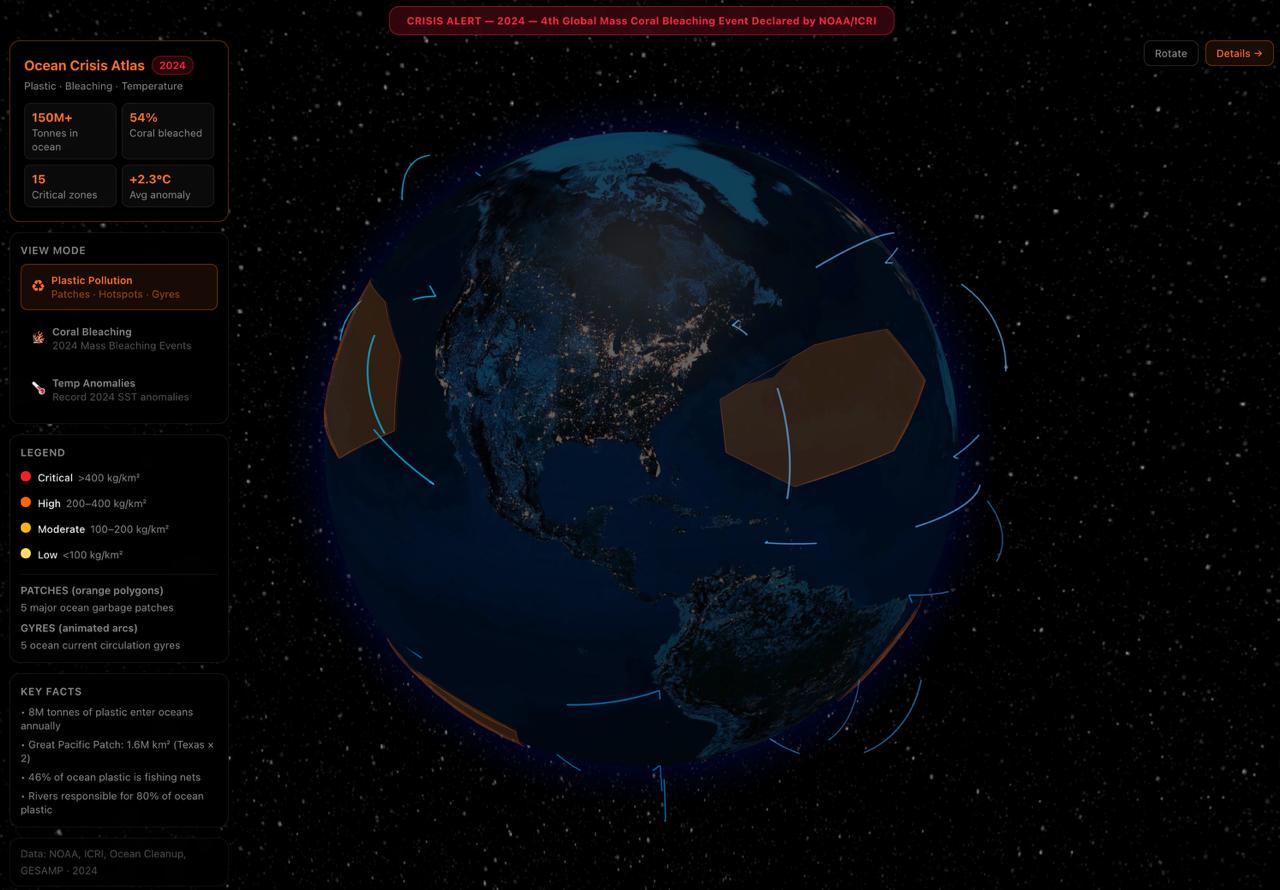
Ocean Crisis Atlas
5 ocean garbage patches, the 2024 4th global mass coral bleaching event, and record sea surface temperature anomalies on a 3D globe.
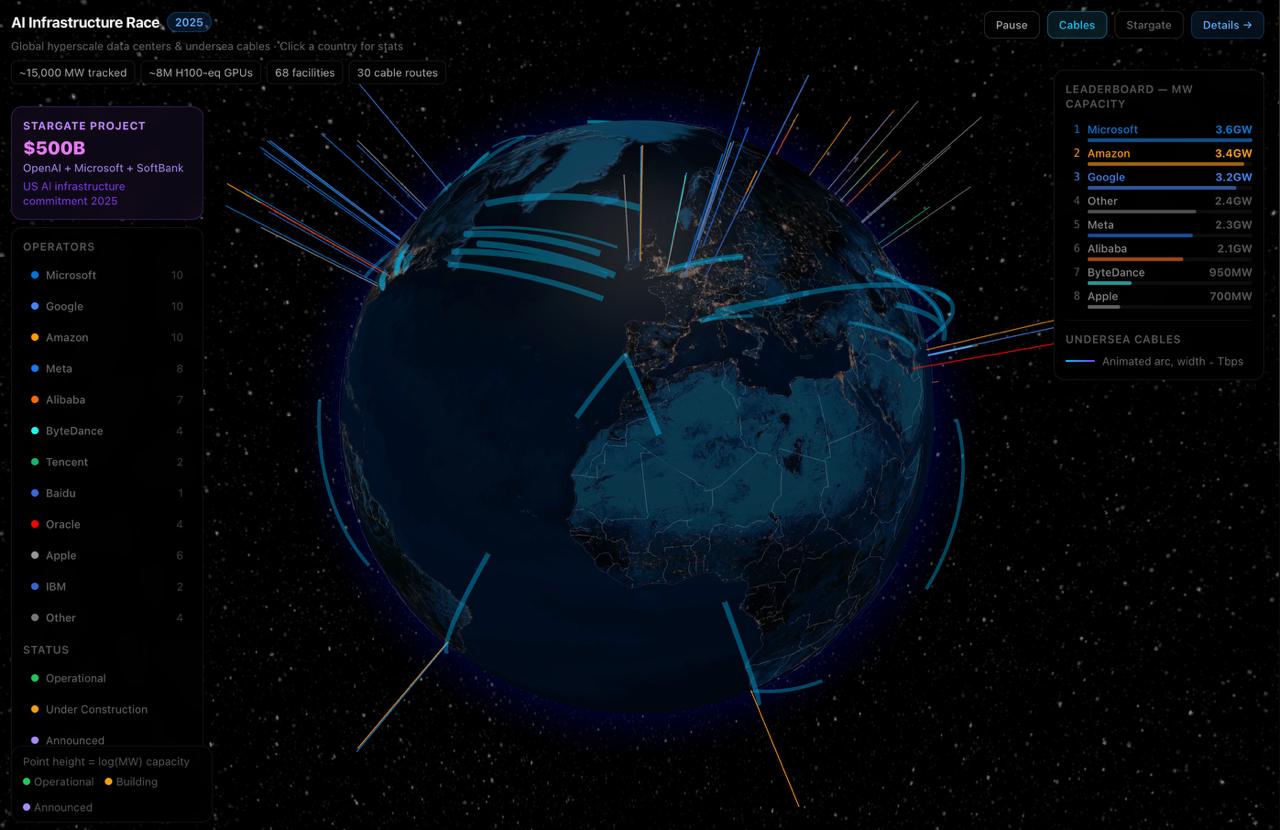
AI Infrastructure Race
82 hyperscale AI data centers, 30 undersea cable routes, and the $500B Stargate race — on a deck.gl 3D globe.
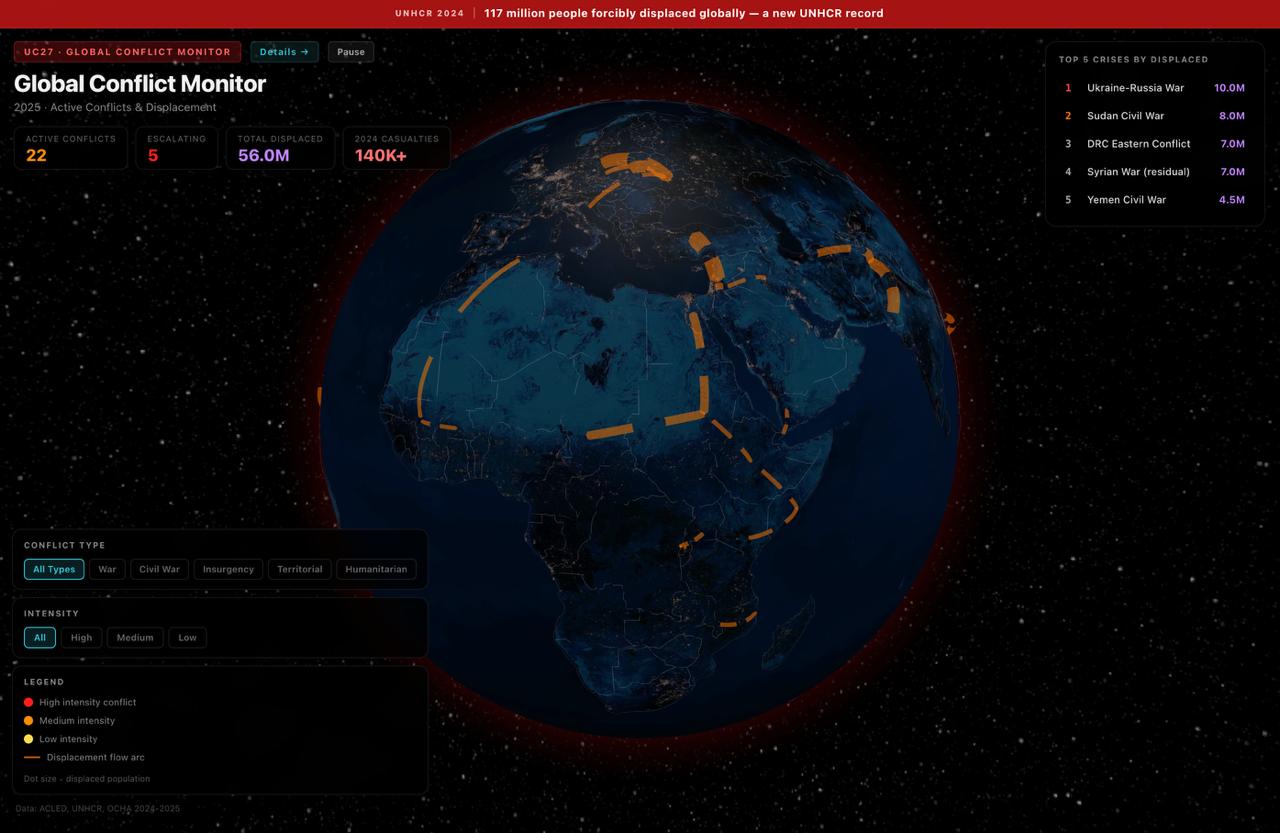
Global Conflict Monitor 2025
24+ active armed conflicts, 25 refugee displacement corridors, and 117M forcibly displaced people — visualized on a 3D globe.
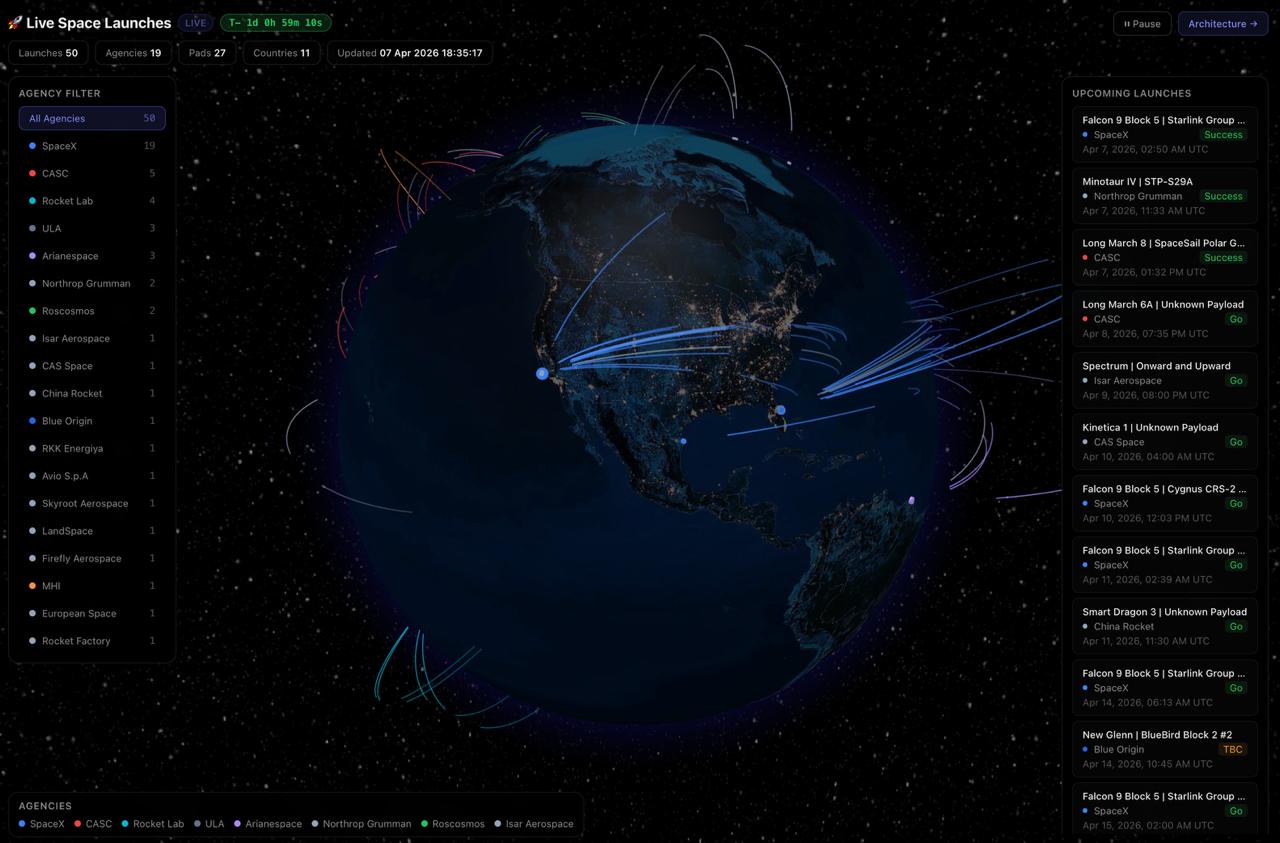
Live Space Launches & Rockets
Real-time tracking of 50+ upcoming rocket launches, launch pads, and space agencies worldwide on a 3D globe with live countdowns.
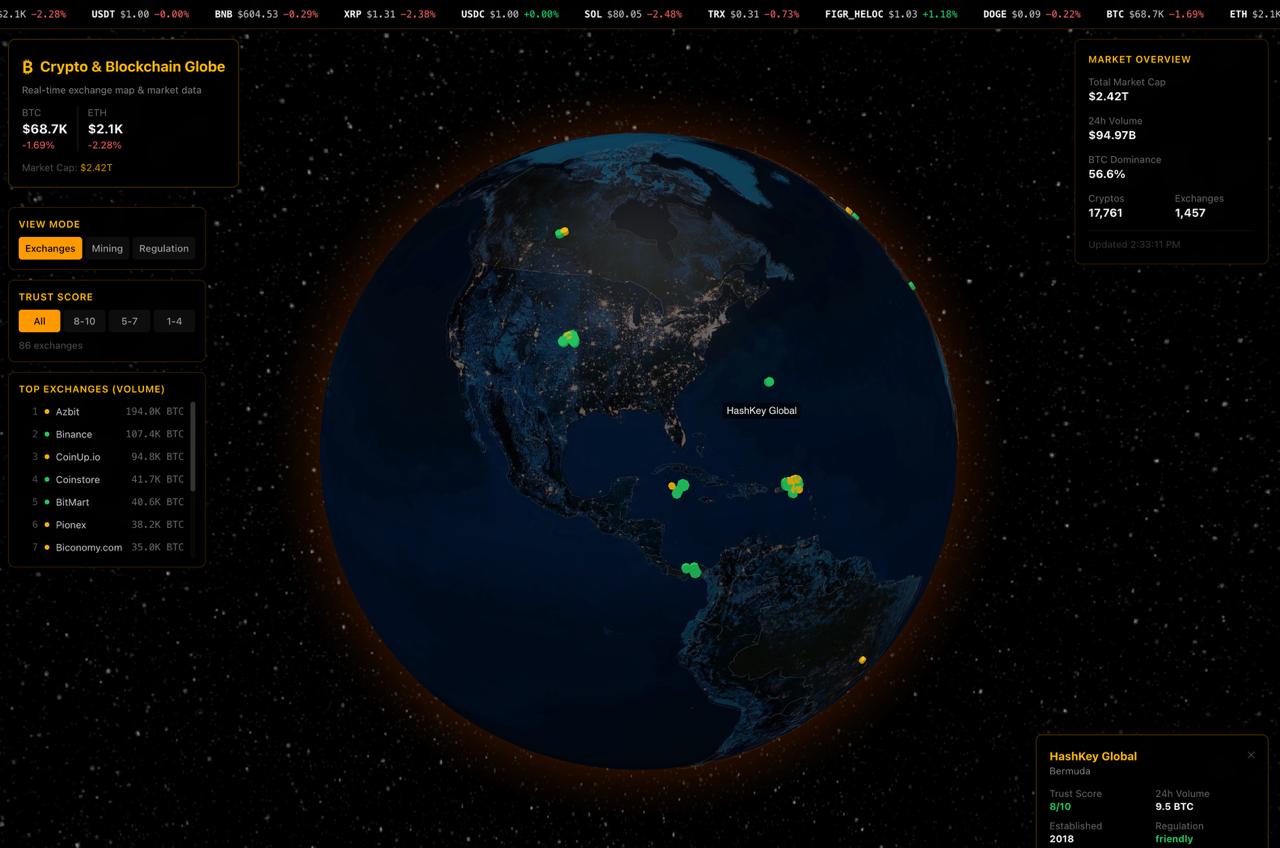
Crypto & Blockchain Globe
Real-time crypto exchange map with live BTC/ETH prices, mining concentration, regulatory status, and $2.4T market visualization on a 3D globe.
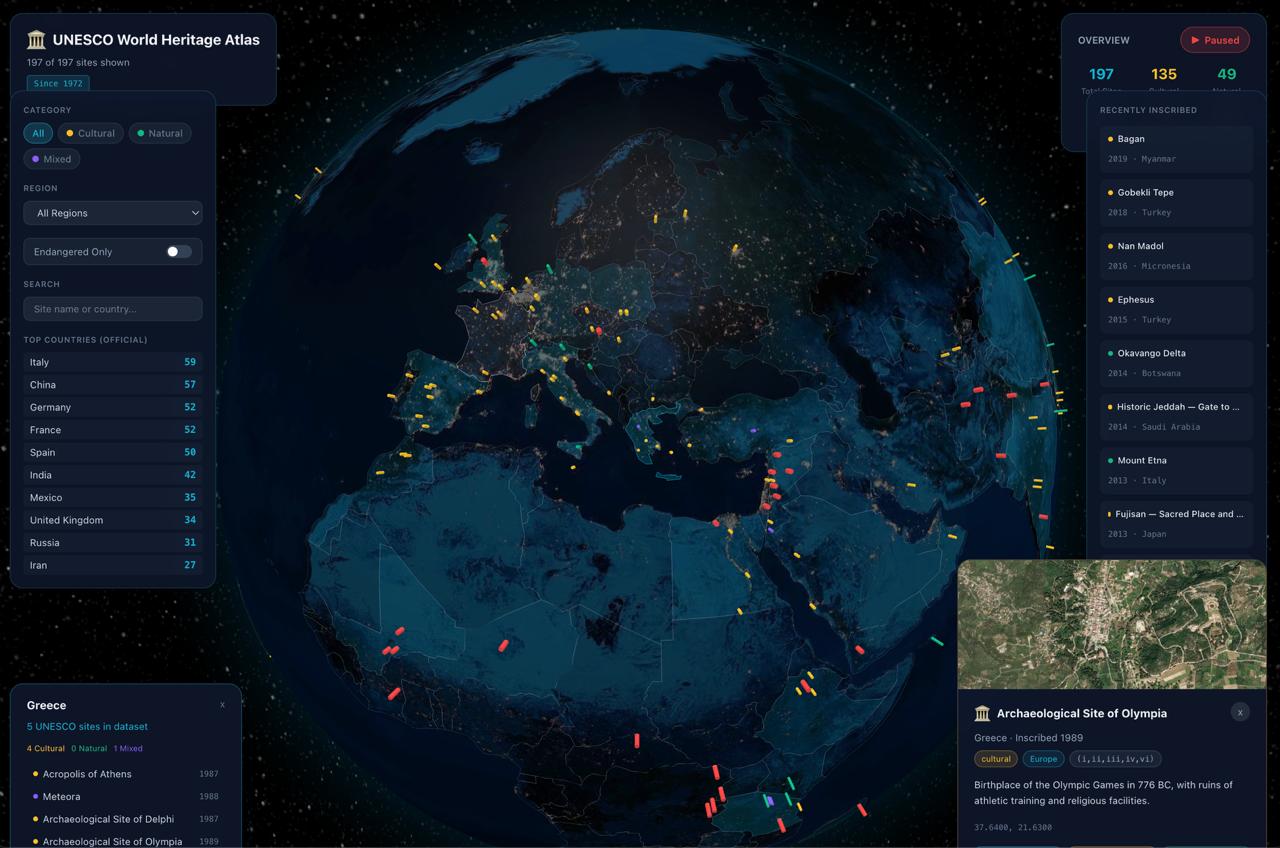
UNESCO World Heritage Atlas
1,199 UNESCO World Heritage Sites on a 3D globe — cultural landmarks, natural wonders, and endangered sites across 168 countries since 1972.