Back to all Use Cases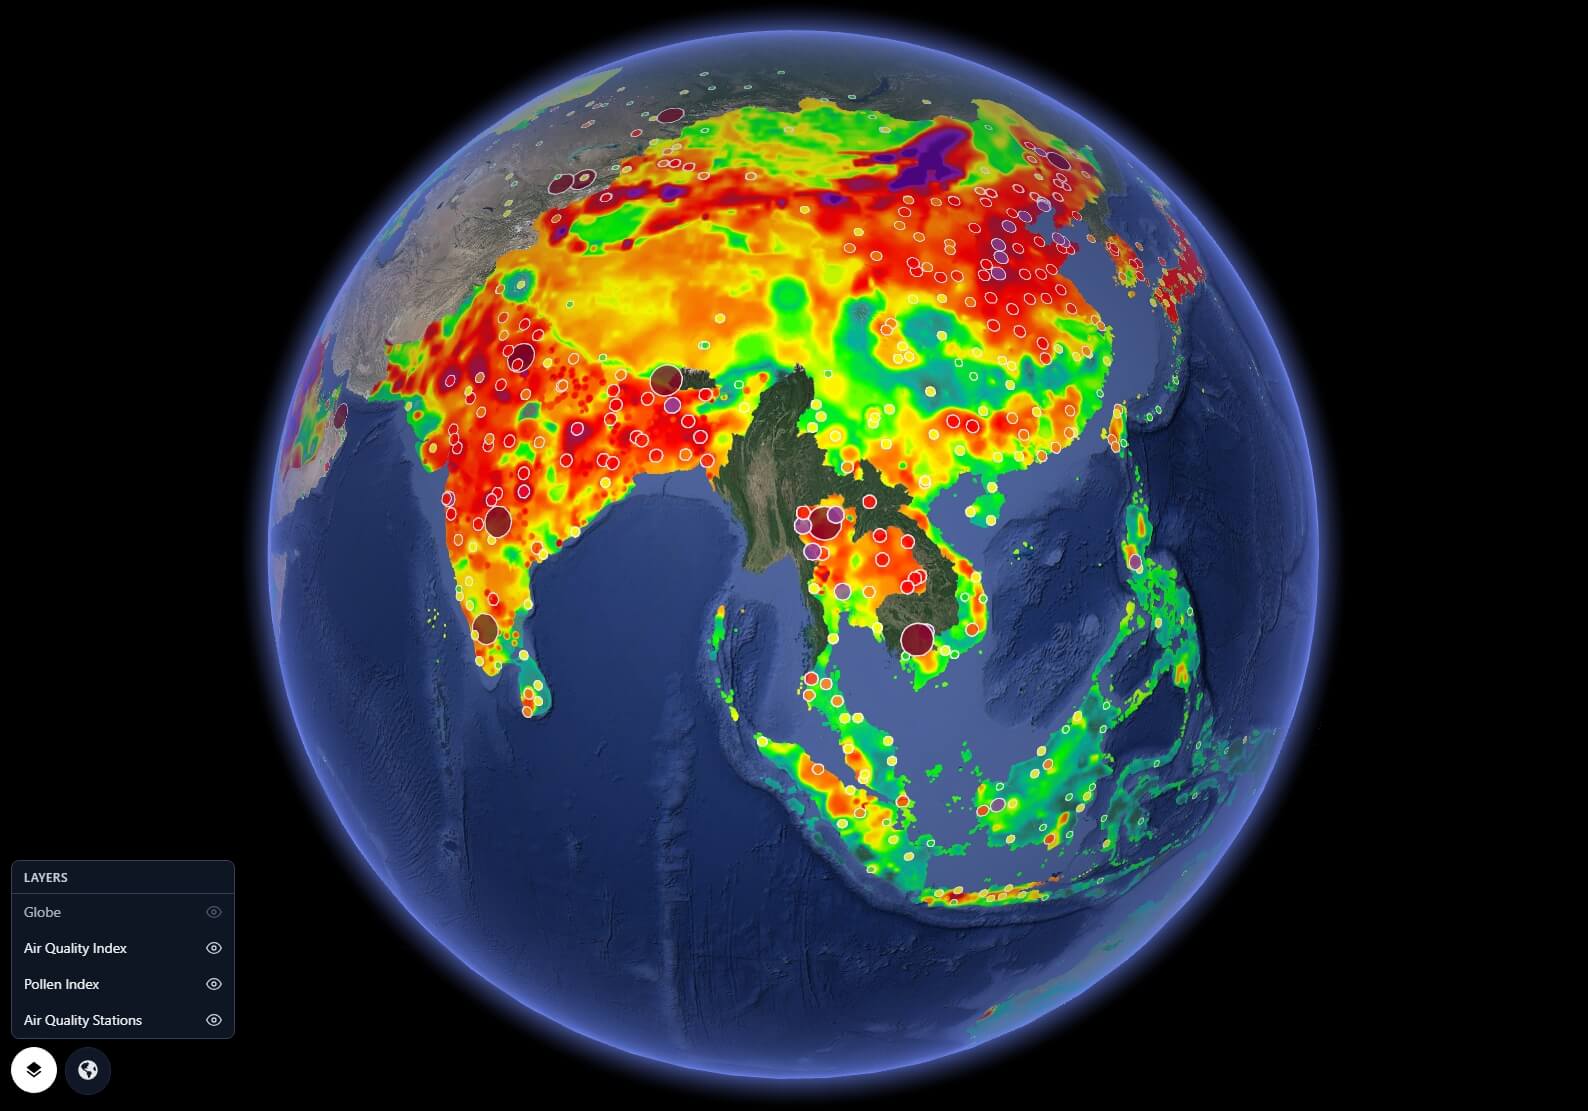 Talk to us →
UC13Environment
🌿 Air Quality Index, Pollen & Stations
A real-time public health layer for the globe. Live AQI heatmaps from OpenAQ's 30,000+ monitoring stations.
Demo Pages
What you'll see
- ✓Live AQI data from 30,000+ OpenAQ stations
- ✓PM2.5, PM10, NO2, and O3 layer toggles
- ✓Pollen index overlay by season and region
- ✓WHO threshold alert visualization
- ✓City-level trend charts on click
- ✓Historical comparison by date range
Tags
AQIAir QualityPollenPM2.5OpenAQ
Want this for your data?
We can build a custom version of this use case for your stack.